|
| |
The objective is to show to what extent office
lights would be dimmed by using a daylight control system. In this manner it can
be assessed if the technology has the expected effect of energy reduction when
only a relatively small glazing area (less than 3% of wall area) exists, as it
occurs in many site offices, and whether and to what amount natural lighting
would have to be increased. This study will also consider the effect of building
(window) orientation on the reduced lighting demand.
At this stage this report does
not assess the increase in heating load due to the reduction of lighting gain.
This will be considered at a further stage of this project.
Back to
Top
|
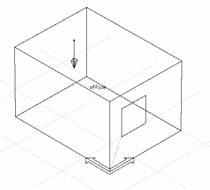
A simple office model was created similar to a
typical office observed at the construction site we under
investigation. The office has a size of 3m * 4m * 2.5m and contains
a 1m-squared window and 2 36W tubular fluorescent lights.
A photo sensor is placed at an appropriate
position on the ceiling to ensure that the whole room still receives
sufficient lighting when artificial light is dimmed.
For this study the lighting control was defined
with a set point of 500 lux as the required illuminance for office
use. Furthermore a daylight factor of 5% was chosen as suggested in
Table 1.13 of the CIBSE Guide A.
The artificial lighting can be dimmed down to 10%
of the full light output and will be switched off when daylight has
risen above the pre-set level.
|
 |
Back to
Top
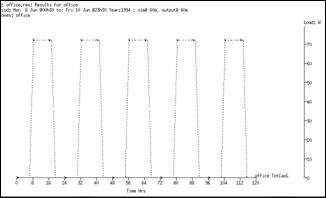
Without
Daylight Control System
Taking
into consideration that employees usually leave office lights
switched on during the whole working day, the weekly energy per
office is estimated 3960Wh. In this case lights are switched on 55
hours per week at a full light output of 72W.
|
|
|
|
|
Artificial
lighting load without daylight control system |
With Daylight Control System
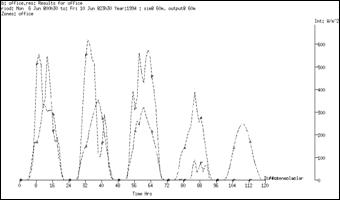
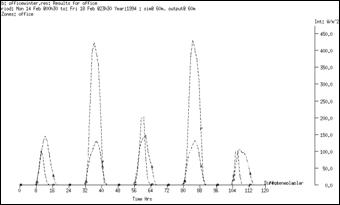
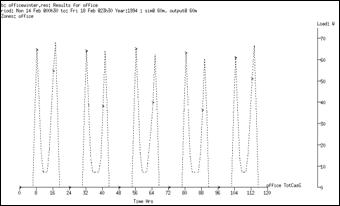
The following graphs demonstrate the change in required
artificial lighting load for a typical summer and winter week when a
photoelectric dimming control is used in a south orientated office.
Typical summer week |
|
|
|
|
|
Normal and diffuse solar
radiation |
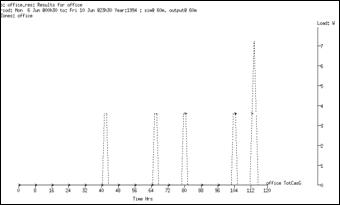
Typical winter week |
Dimmed artificial lighting load
|
|
|
|
|
|
Normal and diffuse solar
radiation |
|
Dimmed artificial lighting load |
|
The simulation of the summer week demonstrates that daylight
alone provides sufficient illumination for 70% of the time. The
electric lighting would be used occasionally but dimmed down to a
minimum during full day light output.
During the winter
week daylight alone does not provide sufficient illumination.
However, artificial light would be dimmed down most of the time
especially in the period between 10am and 2pm where lighting can be
dimmed down to 13% of the full light output.
The table below states the weekly hours of lighting as well
as maximum and average light output for all four season for using
photoelectric dimming the office with a south orientated window.
|
|
|
|
Season |
Hours of electric lighting
% |
Maximum light output
W |
Average light output
W |
|
Winter week |
100 |
68.1 |
35 |
|
Spring week |
62 |
21.1 |
10 |
|
Summer week |
29 |
7.2 |
4.3 |
|
Autumn week |
90 |
64.7 |
23 |
|
|
| |
Hours of electric
lighting and light output for south facing window |
|
|
The effect of light dimming is, as expected, high even with a
relatively small glazing area. Considering that the increase of
glazing area would lead to an increase of heating demand, the amount
of natural lighting is sufficient and windows do not need to be
larger.
Having a south facing window would theoretically give the
highest energy saving. However, in practice employees in south
facing office can experience glare during most of the afternoon and
therefore are forced to make use of the blinds, which would have a
negative effect on electric light dimming.
Thus, we suggest avoiding, if possible, that office
accommodation have south facing glazing areas but rather east or
west facing windows.
The following table summarises the theoretical amount of
energy savings for our office model dependent on window orientation
and season of the year.
|
|
|
Season
|
Window
Orientation
|
|
East |
West |
South |
North |
|
Winter |
50% |
50% |
50% |
50% |
|
Spring |
91% |
85% |
91% |
82% |
|
Summer |
97% |
90% |
98% |
88% |
|
Autumn |
67% |
63% |
71% |
63% |
|
Yearly Average |
76% |
72% |
78% |
71% |
|
|
| |
Percentage of energy
savings |
|
|
Depending on the orientation, annual energy savings between
71% and 78% of the current lighting demand in offices can
theoretically be achieved by installing automatic daylight control
systems in office accommodation.
However the following factors, which influence the
performance of the system, have not been included in the previous
simulation but need to be considered to achieve realistic values:
|
|
|
·
Surrounding buildings
·
Window maintenance (dirty windows)
·
Use
of blinds to avoid glare |
|
|
In order to assess the influence of surrounding buildings,
energy savings during sunny days have been compared with savings
during overcast days, where sunny days would present an open field
position and overcast days present a sheltered position of the
office.
It has been identified that the presence of high surrounding
buildings can reduce energy savings by up to 30% compared to an open
field position. |
|
Back to
Top
This study has demonstrated that an automatic daylight
control system would be appropriate for construction site offices, which do not
have large glazing areas.
Depending on orientation, surrounding area and employee
behaviour, expected energy savings are estimated between 45% and 65% of the
current lighting demand in site offices.
Back to
Top

|
