It was expected that calculating energy yields using averaged data from weather stations would lead to a rather pessimistic view of the actual energy available for capture by a small ducted wind turbine. This is due to the turbulent nature of the wind resource in the built environment, where gusts may be lost by averaging the data, or by not measuring the wind velocity frequently enough.
Wind velocities in the urban canopy change rapidly, and hence frequent measuring of both velocity and direction was necessary. This data allowed a more accurate representation of the wind resource to be established for the James Weir building. Using this data, a model was created to calculate the instantaneous power output from the DWT for every data point. These calculations led to another set of data consisting of power with time, and led to the calculations of the area under the graph to ascertain an energy yield for the measured data.
The model, proposed by Dr A Grant and Dr N Kelly ( University of Strathclyde ), does have some limitations and these are discussed below:
The method for calculating instantaneous power takes no account of the present state of the turbine. For example, the turbine will react differently to a heavy gust of wind if it were already spinning compared to it being stationary. The inertia of the turbine could be worked into the algorithm to allow a more accurate model to be constructed.
The power available in the ducted wind turbine is given by the following equation:
P = A / (3 Ö 3) * Density * Diff ^ 1.5 * Velocity 3
Where; A = Area of the Duct (m 2)
Density = Density of Air (1.25 kg/m 3)
Diff = Pressure Differential
Velocity = Wind Velocity (m/s)
The pressure differential in the above equation is a coefficient for the direction and building type to be used in the simulation. This coefficient takes into account whether the building is in a sheltered, semi-sheltered or exposed location. Also the pitch of the roof is factored into the coefficient. These two factors together with the angle of incidence of the wind will give a coefficient to limit the performance.
The pressure differentials used in this project have been calculated in the Air Infiltration and Ventilation Centre Handbook called "Air Infiltration Calculation Techniques - An Applications Guide". The handbook provides a table for each of the different roof types, and has values for the pressure differential given the angle of incidence of the wind. The angle of incidence’ range from 0 to 360 ° , at a spacing of 22.5 ° . The simulation uses a lookup table to generate a pressure differential for use in the power equation.
The actual power captured by the generator will have a limit (similar to the Betz limit for a HAWT), but will also be governed by the design and quality of the generator itself. The above equation could be modified to include the performance coefficient of the generator, which would give the electrical power output from the turbine.
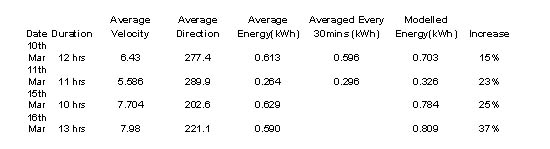
The model algorithm was run on four different data sets from various days in March. This allowed varying wind speeds and directions to be used in the calculations. The total energy yield from the more frequent calculations is compared with the yield using averaged data. These results are given in the following table.