|
|
Introduction We have been offered the opportunity of applying our methodology to a small community on a peninsula to the west of Glasgow . The peninsula is divided in two, on a north to south axis, with a ridge running the length of the peninsula. The communities on each side have different community councils so the ridge is a natural divide of community resources. We will be applying our methodology to our selected case study area on the east side of the ridge, comprising of the villages of Rosneath and Clynder. The community had an interest in installing a wind turbine to supply the villages. The area that we will be investigating has a range of building use from residential and small commercial units to light industrial workspaces. However the bulk of the property in the area is residential. Objectives By applying our methodology to the community we hope that we will achieve the following outcomes from this casestudy;
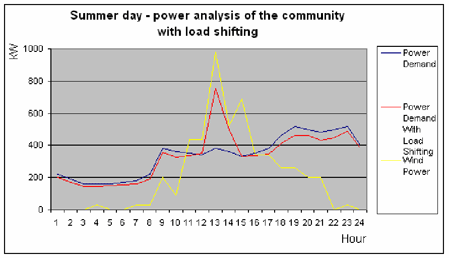
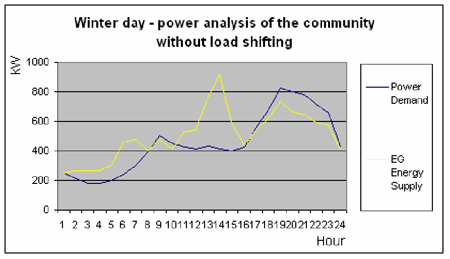
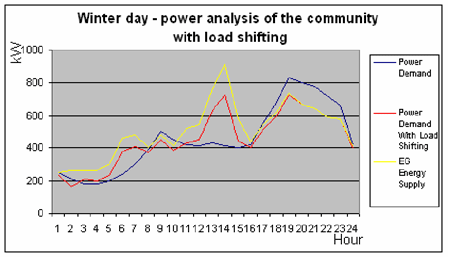
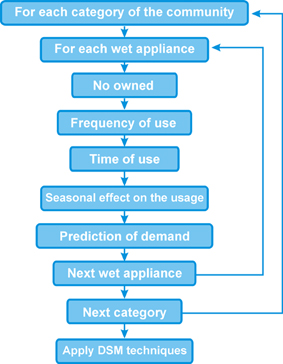
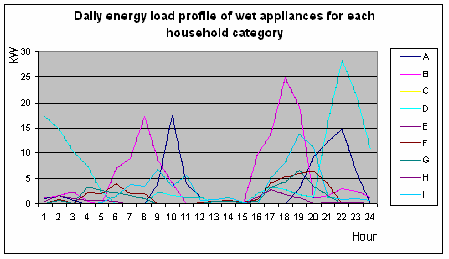
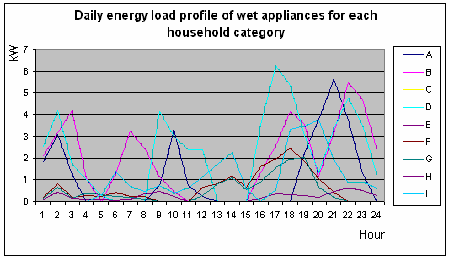
Data collection We collected the information that we needed to model the energy demand in the two villages. We needed to model the existing demand profiles of the inhabitants to get a clear picture of the current patterns of energy use. With the information gathered we set about predicting the number and type of goods likely to be present in each household category within the village's population. To model the demand profiles we have based it upon an averaged domestic profile taken from BRE [8]. Within the community of 1000 households, there are 9 different categories of household occupants such as 1 adult, 2 adults with children or 2 pensioners etc [9]. In order to investigate the energy use of the community's appliances we had to identify the time of use of common household appliances by the categories of household. The data can be obtained by either collecting statistical information or conducting a survey. From information obtained from the dti we identified the range of appliances in the houses of each population category and their power consumption [10]. The appliances were then grouped into categories of use in the home. This was repeated for each of the different household categories that were detailed in the census. The appliances that we are focussing on are the washing machine, dishwasher, washer dryer and tumble dryer. Together we called them the wet appliances. We chose to focus on the wet appliances because there will be a distribution of their time of use and the appliances often take advantage of lower tariffs in off-peak periods. Additionally the use of these appliances should be relatively constant through out the year, with the possible reduction in tumble dryer use over the summer period. Energy conservation The energy efficiency measures that can be applied can be divided into two areas. The first area is associated with the building envelope and building service plant and systems. The second is associated with consumer behaviour within the household and the use of their electrical appliances. From our investigation of the community's energy efficiency, our work revolved around the second area with the aim to reduce consumer demand. One initial method of reducing energy use would be to replace older appliances with new appliances that are more efficient. Although we cannot expect this to happen instantly, newer appliances will steadily make their way into buildings over time, contributing towards reducing electrical demand and running costs of the building. Further ways of reducing energy use will lie with the council's continuing improvements to reduce heat loss in the housing stock on the peninsula. Define time period We decided upon a two week time period on which to base our study. This will allow the appliances to be used at least once across the range of household categories. Grid and supply options There are three supply options that were investigated to supplement the electricity being used by the community. These were generation from wind, solar generation in the form of photovoltaics (PV)) and Combined Heat and Power (CHP). We have assumed that the proposed site for the wind farm could support up to a maximum of two wind turbines. For this study we modelled the supply from two 660 kW wind turbines mounted on the North South ridge on the peninsula. We investigated the supply from the two turbines and its substantial contribution towards the electricity demand in the communities. For this analysis we used Merit which is a supply and demand matching software. From this we concluded that generation from wind was a viable proposition. There was the possibility for solar generation due to the orientation of the houses in the community. However once we investigated further and modelled the generating capacity of a solar installation using Merit, we discovered that the power generated from such an installation would be rather small, would contribute little towards the communities needs and was discounted. We also included a CHP installation as a small district heating scheme in the community. The CHP unit was sized with an electrical output of 600 kWe . Compare supply and demand profiles The supply from the wind was a substantial contribution towards the demand in the community. However the generation is unpredictable and from the supply profiles generated by Merit we did not obtain a particularly good match with demand in the community. The supply from the CHP was more predictable and was effective in supplying part of the demand in the evening. With this temporal mismatch we looked to redistribute the community's demand from the two villages over a 24 hour period, to see what could be obtained with a more flexible system. Our aim was to attempt to reduce the peak demand and redistribute loads to times when there was generation from wind. Apply DSM techniques We calculated how much electricity would be used by the community if we assumed that if all the wet appliances were able to be load shifted to take advantage of the output from the embedded generation. These results are shown in spreadsheet called environmental and economical analysis.xls. In these 2 graphs we show how the electricity loads of the wet appliances in the community can be load shifted. During a summer period we assume that electricity will only be generated by the wind turbine. |
|||||||||||||||||||||||||
|
|||||||||||||||||||||||||
|
|||||||||||||||||||||||||
|
|||||||||||||||||||||||||
From the graphs we can see the much higher peaks during the weekday. This is when most people have a work orientated routine rather than at the weekend when there is a more of a leisure based routine. This tends to result in a more constant load. Implementation of DSM control We have assumed that the mechanism for load shifting would be long wave radio switching and could be brought about by means of instantaneous or rapid response when the shifting of loads is required. A fairly rapid response will be required in order to give the appliances time to come online. In this application controlling loads by radio switching may not be able to deliver the system response that we require. A better form of control would be the Internet based control systems that have been developed through collaborative research carried out at University of Strathclyde [11]. These communication systems would be better suited for our applications because they will give a much better response time after switching and a far higher level of control level due to more complex commands that can be sent via the internet. Discussion From our investigation of loads present in the household, the wet appliances are the largest component of household loads after electric heating and water heating. However it is possible that these loads are already being controlled by utilities within separate schemes and therefore cannot be used in this study. If these loads were present on an islanded network all attempts to shift loads should be considered to maximise the efficiency of generation. Alternatively if there is supplementary power from a grid connection it may not be economically viable to invest time and capital to move these loads. Hot water and storage heaters are ideal as when they are applied they will be a constant load at the nameplate rating. The wet appliances which we have chosen to control in this casestudy are not as well suited for shifting. It is possible but has to be undertaken with care to ensure a reasonably constant load. During the cycle of operation, the electricity used will vary as the appliance heats water and uses pumps and motors. These peaks may cause problems when they are attempted to be matched to an already fluctuating supply profile from wind generation. It is hoped that with the combination of different appliance manufacturers and a staggered start, these peaks will be smoothed enough to allow the shifted loads to be of use. Further work in this area is required to see if better control could be achieved with more precise information about the loads in the community and increased levels of automation and control by algorithms developed for this purpose. |
|||||||||||||||||||||||||
| Top |