C.3 Customize
the Climate Graph
|
Exercise
purpose: |
To customize
the climate graph. |
|
|
|
|
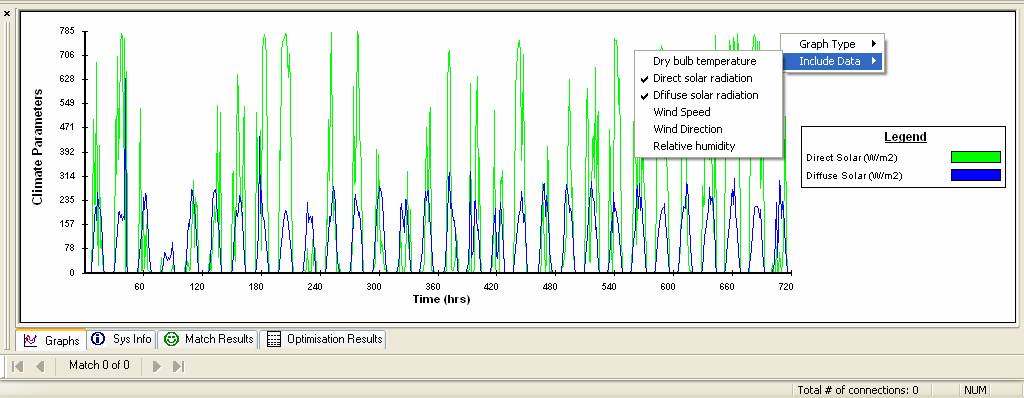
3. Select
climate data items to be displayed. |
You can select climate data items to be displayed in the graph. Move the mouse point over the graph in the bottom window frame and click the right mouse button. A pop-up menu will appear on the graph. Select the ‘Include Data’ menu which contains 6 data items you can choose. Check or uncheck items as you wish to display in the graph. The graph will be updated each time items are checked or unchecked.
|
|
|
|
|
This is the end of climate session. |
|