THERMAL
BRIDGES IN PANEL SYSTEM T06B
APARTMENT BUILDINGS, SLOVAKIA
Roman
Rabenseifer,
Slovak Technical University, Bratislava,
Slovakia
ABSTRACT
INTRODUCTION
COMPUTER MODEL
OUTER ENVELOPE ANALYSIS
OF THE APARTMENT MODEL
CONCLUSIONS
ACKNOWLEDGEMENTS
REFERENCES
ABSTRACT
A case study is used to introduce a two-step thermal demand calculation
for buildings in order to take thermal bridges into consideration. In the
first step the outer envelope of a typical apartment is 3-dimensionally
modelled and a 3D thermal-coupling coefficient is calculated. In the second
step the thermal demands of the whole building is calculated using three
variations of the outer envelope design. Each variation is calculated in
1D and 3D. The difference between the results of 1D and 3D calculations
is used to show the influence of thermal bridges upon the overall heat
loss of building.
INTRODUCTION
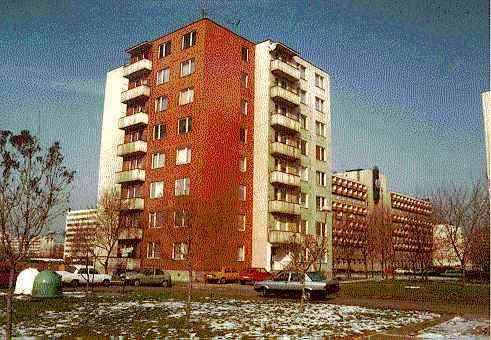
A large number of pre-fabricated apartment buildings, built during
the communist era of the former Czechoslovakia, were inherited by both
successor states. All of these buildings fail to meet today's thermal performance
standards,thus making them a target for energy efficiency improvement efforts.
It is important to have a method to determine whether or not proposed modifications
will actually result in improved energy performance. In this case, the
use of computer simulation appears to be the best approach. This is because
most of the prefabricated buildings are made up of the same panel systems.Therefore,
it is possible to economically develop a very detailed and precise computer
model of the typical panel system. This model can then be re-used to test
various improvement measures under different climatic conditions. The precision
of the computer model described above depends on the calculated precision
of the thermal-coupling coefficient (conductance) of the construction details.
Thermal-coupling coefficient is a proportion factor that influences the
heat flow between neighbouring spaces. In order to take into account thermal
bridging it makes sense to calculate thermal-coupling coefficient three-dimensionally.
One dimensional calculation can only serve as a rough estimation; it does
not correspond to reality at all. In addition, construction details in
3D computer models can be used for examination of critical points such
as room edges, attic details, etc. These are particularly important from
the point of view of the building practitioner. In this study the computer
software WAEBRU V5.0 [4]was used to calculate the 3D thermal-coupling coefficients
of construction details. It was able to provide all of the information
relevant to describing the thermal characteristics including: maximum and
minimum surface temperature (with respective dewpoints for specific sets
of boundry conditions), a matrix of temperature weighting factors (g-values)
and a conductance matrix. The overall heating demand for the entire apartment
building was calculated with the help of the computer software WAEBED [3].
This program allows the examination of heat loss through transmission of
the building envelope using both one and three-dimensional calculated values
of thermal coupling-coefficients. In order to elaborate this computer model
further, a case study using the pre-fabricated panel system T06B was undertaken.
This panel system is one of the most common types of pre-fabricated systems
in use in the former Czechoslovakia today. We created a model of an apartment
envelope (different for typical and attic apartment) by turning of which
by 90° one floor of such an apartment house arise (Fig. 1 and 2). The
difference between this model and other computer models is that it consists
of a set of three dimensionally modelled construction details and three-dimensionally
calculated thermal-coupling coefficients. This information can be used
to examine the thermal demands under different climatic conditions for
any apartment building built from the same panel system (even though the
form of the building may vary, the details usually remain the same). Of
course, after slight modifications are made to the model it can be used
to test a variety of proposed design improvements.
CROSS-SECTION
TYPICAL FLOOR PLAN
Fig. 1. Division of the entire building into temperature zones.
Fig. 2. Typical apartment plan by turning of which by 90 degrees
one floor of an apartment house arises
COMPUTER MODEL
According to H. Werner [5]: "the notion "thermal demands"
can be used when an amount of heat, determinable thanks to certain given
marginal conditions is being "calculated". Such calculations
are used to optimize the thermal quality of the building envelope in the
planning phase rather than to make a prognosis about the real consumption
to be expected. The notion "consumption" means the real in practice
existing amount of consumed heating energy." According to Slovak standards,
the normal basis for determining thermal demands is through an one-dimensional
calculation of the thermal-coupling coefficient [L=U.A]. This approach
only partly considers thermal bridges and in such a way that only external
measures are taken into consideration. To explain why this may be a problem,
it is helpful to discuss in more detail the notion of thermal conductance
(thermal coupling coefficient). "Only panel-like building components
with strictly surface parallel layers (a product consisting of U-value
and surface) can be accurately represented using an one-dimensional [surface-related]
thermal-coupling coefficient" [2]. However, based on practical experience,
the cross-section of a panel changes in all three axis directions in the
case of a thermal bridge caused by materials and construction. "Therefore,
it can only be described with the help of a three-dimensionally calculated
thermal-coupling coefficient. Where the cross-sections of a panel change
in two axis directions it is possible to first calculate the length-related
thermal-coupling coefficient as L2D [W.m-1.K-1 ] where
 ..... (1)
and l stands for the length of the building component" [2]. "The
use of a computer is inevitable for calculating 2D and 3D thermal-coupling
coefficients. At this point, one may question whether or not it would be
easier to three-dimensionally determine the entire thermal-coupling coefficient
for the entire envelope at one time. This would put an enormous demand
on the memory capacity of the computer. Considering the current capacity
of PC-s such an operation is not possible. Therefore it is necessary to
separate the heat transmitting building envelope before calculation into
1D areas on one side and 2D and 3D areas containing the predicted thermal
bridges on the other side (see the sketch).
Sketch. Division of the outer apartment envelope (different
for typical and attic apartment) into 3D, 2D and 1D areas
The 1D areas can be calculated according to standard and 2D and 3D
areas with the help of a numerical process producing 2D and 3D thermal-coupling
coefficients. Total basic value LTOT for our considered
apartment comes then to:
 ..... (2)
The thermal-coupling coefficient determined in this way takes into account
the influence of the thermal bridges relatively accurately. When compared
with the standard method (one-dimensional) LTOT we
can define the supplementary figure LHB. This corresponds
with the sum of the chi and psi values, which can be derived from the 2D
or 3D thermal-coupling coefficients. These coefficients can conceivably
be used again as a building-system-characteristic quantity for the calculation
of other buildings. The total thermal-coupling coefficient LTOT
with the use of chi and psi values (indirect process) makes:
 ..... (3)
The thermal demands of one building calculated on the basis of the
examination of 3D thermal-coupling coefficient allows us to avoid the problems
resulting from "overly optimistic" predictions from 1D examinations.
The ability to catch potential problems early (and accurately) is helpful
both for modification to existing structures as well for the design of
new buildings"[8]. For the purposes of this study, the examination
of the 3D thermal-coupling coefficient was done using WAEBRU V5.0 [4].
This is a software package used for the calculation of temperature distributions
and heat flows in building structures; particularly those with thermal
bridges. "Key features of WAEBRU are:
Calculation of base solutions (method of finite differences) - WAEBRU
allows the precision of numerical solutions to be influenced and controlled
by the user (definition of calculation parameters)
Specification of boundary conditions (reference air temperatures in
the spaces under consideration) and heat source power assumptions in a
separate evaluation branch of WAEBRU. A comparison of evaluation results
under varying conditions is thus accomplished promptly, since it is unnecessary
to repeat the calculation of base solutions for different sets of conditions
(principle of superposition)" [4].
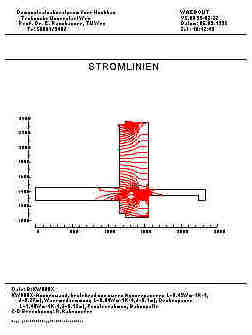
Examples of two- and three-dimensionally modelled construction details
are shown in Figure 3. a. and b. (CorelDraw illustrations with heat flow
lines determined by WAEBRU V5.0).
Fig. 3. a. Examples of three dimensionally modelled construction
details (CorelDraw Illustrations)
The thermal demands of the entire apartment building were calculated
using the computer program WAEBED [3] which handles non-steady state conditions.
In this case climatic data [6] of an Austrian village, Wolfsthal (very
close to Bratislava ) was used - Slovak or Czech climatic data is not yet
available in the program.
The entire building was divided into 10 zones according to the Figure
1. Two of the zones are considered unheated (basement and staircase) and
the rest (apartments) were presumed to be at Ti =
20 degrees Celsius. Ideal heat control was also assumed.
KK000X
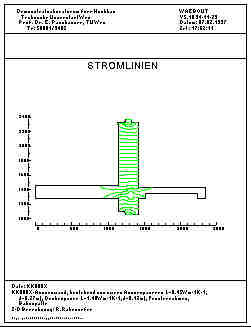
KK000X - Heat flow lines
KW000X
KW000X - Heat flow lines
KWX00X
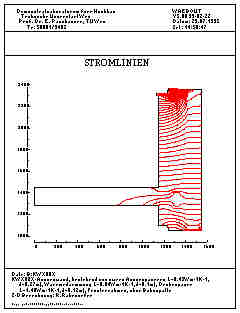
KWX00X - Heat flow lines
Fig. 3. b. Examples of two dimensionally modelled construction
details for existing state, model I and model II (CorelDraw illustartions,
heat flow lines are determined by WAEBRU V5.0)
OUTER ENVELOPE ANALYSIS OF THE APARTMENT
MODEL [8]
The thermal demands for 3 variations of the outer envelope design were
examined: (1) the existing state, (2) Model I and, (3) Model II. Each instance
was examined in 1D and 3D. Model I represents an improvement to the physical
construction of original envelope that includes the addition of 10 cm thermal
insulation and 2,5 cm of external plaster. The thermal insulation layer
is interrupted by a balcony panel. In Model II, the balcony panel was eliminated.
This alternative solution is relevant where a new balcony is constructed
to be self-supporting or when it is omitted altogether. Table 1 shows the
calculated thermal demands for all three variations for one apartment calculated
one-dimensionally and three-dimensionally. In the last column the errors
produced by one-dimensional calculation can be found in percentage of the
correct thermal demands. With the existing construction, the difference
between the three-dimensional and the one-dimensional investigation is
4,60%, but after installing the above mentioned thermal insulation layer
it becomes 16,74%. Despite that bridging effect, the thermal demands have
been decreased to almost one half. After elimining one part of the thermal
bridging (i.e. after demolition of the balcony panel) the contribution
of the thermal bridges declined to 10,20%. This result clearly shows that
the 1D investigation can lead to an underestimation of the heat losses.
In this study we did not investigate the minimal surface temperatures of
building panels containing thermal bridges. Yet from the practical experience
we know that every thermal bridge represents a source of potential construction
damage. As a matter of interest ecological consequences of retrofitting
in form of carbon dioxide emissions are shown. The 1D investigation can
be used to predetermine the thermal demand, but for an advanced planning
phase a 3D investigation is inevitable. You can find evidence for this
in Table 2. According to this table the sum of the 3D-calculated thermal-coupling
coefficients of building panels for the existing apartment (without windows)
shows a difference of 5% when compared with the sum of 1D determined thermal-coupling
coefficients. In Model I (i. e. after installing thermal insulation) this
difference increases to 28%. The "elimination" of the balcony
panel in Model II leads to a decline to 17%. Table 3 and Figure 6 show
the overall thermal demands of the whole apartment house for all three
configurations including the difference between 1D and 3D calculation.
Fig. 4. Thermal demand of one typical apartment calculated for
3 different variations compared with the growth of thermal bridges
|
Variation
|
Thermal Demand
[kWh / (sq.m x a)]
3D Calculation
|
Thermal Demand
[kWh / (sq.m x a)]
1D Calculation
|
Difference [%]
|
CO2-Emission
(gas heating)[9]
[kg / (sq.m x a)]
|
|
Existing State
|
62,87
|
60,11
|
4,60
|
11,95
|
|
Model I
|
25,43
|
21,78
|
16,74
|
4,83
|
|
Model II
|
24,00
|
21,78
|
10,20
|
4,56
|
Table 1. Thermal demand of one typical apartment calculated
for 3 different variations compared with the growth of thermal bridges;
CO2-Emission values based upon the 3D calculation
of heat energy demand
Fig. 5. Contribution of heat bridges in % to the overall thermal-coupling
coefficient of the envelope of one apartment
|
Variation
|
Thermal-coupling
coefficient
[W / K]
3D Calculation
|
Thermal-coupling
coefficient
[W / K]
1D Calculation
|
Difference LHB [%]
|
| Existing State |
55,46 |
52,84 |
5 |
| Model I |
17,54 |
13,67 |
28 |
| Model II |
16,00 |
13,67 |
17 |
Table 2. Contribution of thermal bridges in % to the overall
thermal-coupling coefficient of the envelope of one apartment
Fig. 6. Overall thermal demand of the whole apartment house
calculated for 3 different variations compared with the growth of thermal
bridges
|
Variation
|
Overall thermal demand
[kWh / a]
3D Calculation
|
Overall thermal demand
[kWh / a]
1D Calculation
|
Difference between
3D and 1D Calculation
[%]
|
| Existing State |
212984,1 |
210461,9 |
1,20 |
| Model I |
101463,7 |
93564,8 |
8,40 |
| Model II |
98413,2 |
93564,8 |
5,18 |
Table 3. Overall thermal demand of the whole apartment house
calculated for 3 different variations compared with the growth of thermal
bridges
CONCLUSIONS [8]
As previously stated, in Eastern and Central Europe there is a huge
number of pre-fabricated residential buildings. The majority of these buildings
are situated geographically in areas where the rooms have to be heated
for almost half of the year. The increasing price of energy is forcing
owners to improve their buildings technologically. Although it is not as
bad as doing nothing at all, retrofitting and adding insulation to the
building's envelope introduces a completely new problem - thermal bridges.
Ignoring this problem can cause great disappointment. One of the aims of
this study is to underscore this point. In order to avoid thermal bridges
a computer simulation of the envelope is recommended at the beginning stages
of design planning. In pre-fabricated panel buildings there are a lot of
similar buildings with the same panel system type. Therefore, it is reasonable
to develop a very precise computer model of the given panel system and
then use it in the evaluation of various improvement measures under a variety
of climatic conditions. It is also recommended that the standard (one-dimensional)
calculation of the thermal-coupling coefficient, which does not take 2D
and 3D heat flows into consideration sufficiently, should be amended as
soon as possible.
ACKNOWLEDGEMENTS
At this time I would like to express my warmest thanks to Prof.E.Panzhauser
and Dr.K.Krec
from TU
Vienna , who kindly placed both Austrian Computerpackages WAEBRU and
WAEBED at my disposal and Mrs. S.M. Hill from TU
Eindhoven for English correction.
REFERENCES
[1] EN ISO 10211-1: Thermal Bridges in Building Construction - Heat
Flows and Surface Temperatures, Part 1 - General Calculation Methods, 1995
[2] W.Heindl, K. Krec, E. Panzhauser, A. Sigmund: Wärmebrücken.
Springer-Verlag, Wien, 1987
[3] Programmpaket WAEBED. Version 1.0. Programmpaket zur Berechnung
des Heizwärmebedarfes von Gebäuden. Benutzerhandbuch. Institut
für Hochbau für Architekten der TU Wien, Abteilung für bauphysikalische
und Humanökologische Grundlagen des Hochbaues, Demonstrativlaboratorium
für Hochbau, 1995
[4] WAEBRU Version 5.0. Programmpaket zur Berechnung von Temperaturverteilungen
und Wärmeströmen in Bauteilen. Benutzerhandbuch. Copyright Univ.
Prof. Dr. E. Panzhauser, 1993
[5] H.Werner: Der Europäische Wärmepaß. CEN-Berechnungsverfahren
für den Heizwärmebedarf von Gebäuden. Bauphysik 15, Heft
2, Ernst und Sohn Verlag für Architektur und technische Wissenschaften,
Berlin, 1993
[6] W.Heindl, K.Krec, A.Sigmund: Klimadatenkatalog. Bundesministerium
für Bauten und Technik - Staatlicher Hochbau, Kommissionsverlag: Österreichischer
Ingenieur- und Architektenverein, Wien, 1984
[7] W.Heindl, H.Fuchs, J.Lang, K.Jost: Katalog für empfohlene Wärmeschutzrechenwerte
von Baustoffen und Baukonstruktionen. Bundesministerium für Bauten
und Technik - Staatlicher Hochbau, Kommissionsverlag: Österreichischer
Ingenieur- und Architektenverein, Wien, 1979
[8] E.Panzhauser, R.Rabenseifer: Die bauökologische Belastung der
umgebenden Außenwelt durch sanierte und nichtsanierte Plattenwohnhäuser
anhand eines Beispiels in Bratislava. Proceedings of International Symposium
of CIB W67 - Energy and Mass Flow in the Life Cycle of Buildings, Technische
Universität Wien, Aug. 4-10, 1996
[9] Generaldirektion der Wiener Stadtwerke: Neue Wege für Wiens
Energie, Energiekonzept der Stadt Wien. 2.Fortschreibung, Bohmann Druck
und Verlag, 1991
Back