

  |
| Power Quality Case Study | Conclusions |
Introduction
One of the most important parameters related to grid connection is the "power quality". We can measure the quality of the output signal of an inverter but how can we evaluate the effect of this signal in the network? How is it going to affect the rest of the consumers?Many interesting questions need an answer in this area so we decided to carry out a harmonic distortion steady state analysis.
Aim of the analysis
The objective of the analysis was to measure and evaluate voltage and current harmonic distortion in a supply network with PV generators. Current and voltage distortion for houses and the distribution line were calculated.
Methodology
The steps we followed to carry out the analysis were:- Selection of the case study: We wanted a relevant case study but taking
into account our possibilities to solve it mathematically getting results as
realistic as possible. At the end we chose a small domestic area.
- Electrical modelisation: Different elements in the electrical installation in the
neighbourhood were modelised in an electrical circuit. That was the first step
towards the numerical analysis.
- Mathematical analysis: The steady state response of the circuit was analysed
mathematically solving the voltages and currents generated, taking into account the
first 5 odd harmonics.
- Result analysis: By comparison of the harmonic distortion in the houses and in
different parts of the distribution line, we evaluated the effect of the PV generators.
1. Selection of the case study
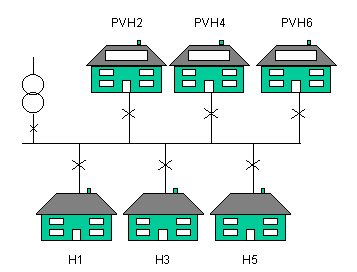
- We have chosen a six house neighbourhood. Three of them are houses with PV generators connected to the network.
- Each one has a 3.5 kWp power PV system.
- The inverter used in all houses is the same. An average quality inverter with a 5% total harmonic distortion.
- The calculation has been done for the worst case. We have considered a typical summer day with a strong irradiance and very low electricity demand in the houses. From PV Output/Electricity Demand Profiles, we have considered a 375 W demand and a 3470 W power generation for each house.

2. Electrical modelisation
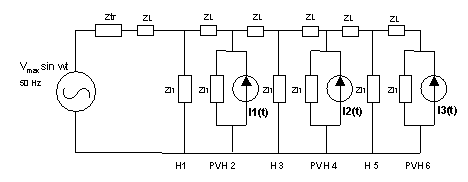
All the elements of the neighbourhood network were represented by different components. Mains signal, PV generators, loads in the houses, the transformer and the distribution line.In the modelisation we considered:
- Impedances:
- Transformer in the nearest substation (Ztr)
- Loads in the houses related to a consumption of 375W with a power factor of 0.95 (Zh)
- Distribution line, between two houses and from the substation to the neighbourhood (ZL)
- Inverters:
- Current sources generating electricity in phase with the voltage signal they receive.
They are connected in parallel to the house load in the distribution panel.
- Mains signal: Represented by a theoretical perfect voltage sine wave.
The neighbourhood was modelised as an electrical circuit to have a mathematical model to work with afterwards.

3. Mathematical analysis
Due to the lack of a software to solve the proposed circuit, we solved it manually. We got general solutions of the voltages and currents in the houses and in the distribution line. Using a spreadsheet, we introduced all the data obtaining the values of voltage and current in the neighbourhood. The voltage and the currents in the circuit are the response to the excitation of the mains and the inverter's current. The calculation has been done for each frequency separately. We have taken into account the fundamental and the 3rd, 5th, 7th and 9th harmonic and we have calculated the total effect of the harmonics by superposition.4. Findings
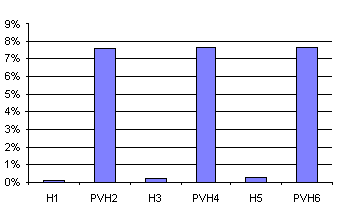
- Considerable current distortion (around 7.5%) can be appreciated in the load in the PV Houses.
- On the other hand, no distortion is appreciable in Not PV Houses.
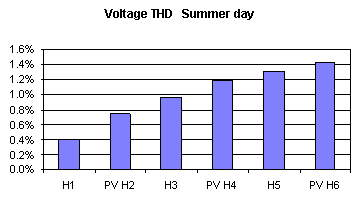
- All the houses in the neighbourhood have a very small voltage distortion, even the ones
that have a high current harmonic distortion.
Fig 3. shows the current distortion for houses with and without PV generators.
A little effect of amplification could be considered. The inverter input has a 5% current THD
while is around 7.5% in the load.

Fig 3.Current Total Harmonic Distortion in the neighbourhood
- Voltage distortion is negligible everywhere. It has an average distortion of 1% but this
does not affect the electrical appliances in the houses.
Fig 4. shows voltage distortion for all
the houses.

Fig 4. Voltage Total Harmonic Distortion in the neighbourhood
Conclusions
- The voltage in all the houses in the neighbourhood is almost perfect. The distortion is negligible so the electrical appliances are not going to be damaged.
- The distortion of the current in a house with PV installation is considerable (THD=7.5%) but not in a normal house (THD=0.1%)
- There is a little amplification effect in the current distortion (5% in the inverter vs. 7.5% in the PV house load)
|
|
Back To Top |
| Home | Overview | System Design | Grid Connection | Environment | Economics |
| Links | About Us |
© Copyright 1999 Bastarrika Kalantzis Zurutuza
Updated 12 April 1999