Wind Concept
Choice of wind turbine
The choice of a wind turbine had to be done taking into account the wind resource available at the chosen location. However, another decisive factor was the amount of available information about any specific model of wind turbine that we could choose. Wind turbine companies do not share much information about their models, neither concerning design aspects nor about electricity output. Nevertheless, we found a solution to this problem.
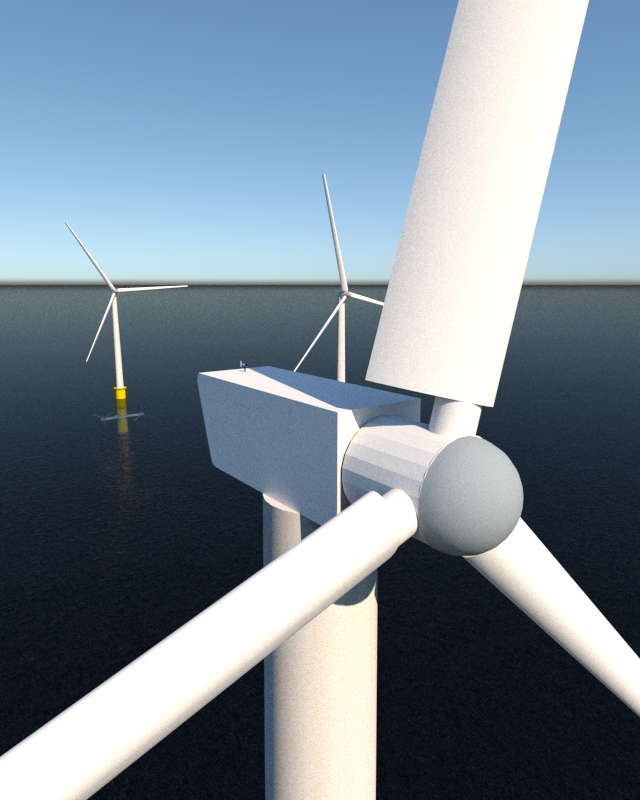
The National Renewable Energy Laboratory (NREL) has proposed different turbine concepts that can be used for research purposes. The chosen wind turbine for this project is the NREL 5 MW wind turbine [1]. The existence of detailed information about the characteristics of this turbine has been a decisive factor when choosing this turbine. Additionally, it has been used in a significant amount of academic wind projects and articles, meaning that it is a deeply tested and validated model.
This turbine has a rated power output of 5 MW. The wind speed values for which it produces energy are the following:
| Cut-in wind speed | 3 m/s |
| Rated wind speed | 11.4 m/s |
| Cut-out wind speed | 25 m/s |
Wind resource analysis
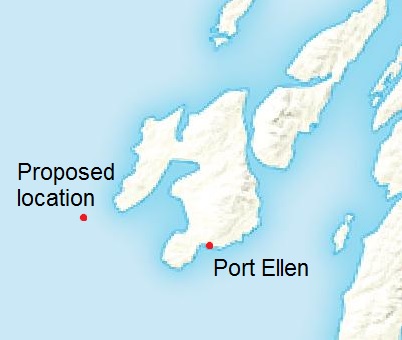
In order to calculate the total energy output of the turbine, it is required to analyse actual wind data from the chosen location, close to the Isle of Islay. The data for this analysis was provided by Met Office [2], and it was based on their metheorological station placed in Port Ellen. The provided files contained average and extreme wind speed records from 2010 up to 2017.
The first step after acquiring the data was to 'transpose' it from Port Ellen to our considered location. This was achieved by using the methodology proposed by Ben Amar, Elamouri and Dhifaoui (2013) [3]. Considering the terms of the article, it was assumed that the area near the metheorological station is a slighlty urbanised zone, whilst the hybrid devices are located in a large area of water. Moreover, the heights are different in both locations: wind speed measurements are taken 17 metres above sea level, while wind rotors are 90 metres above sea level. Therefore, the obtained wind speeds in the actual location are higher than those in Port Ellen.
Once wind data is transposed, the statistical analysis can be performed. A standard wind data analysis requires wind data adjustment to a distribution curve. For average wind data, the distribution used is normally a Weibull distribution, while extreme wind values are adjusted using a Gumbel function. As the aim of this analysis was to calculate the yearly average power output, average wind speeds were used, and therefore the Weibull distribution was adopted.
Statistical analysis
Weibull distribution has the following cumulative distribution function:
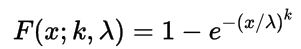
Therefore, the parameters k and λ must be calculated. In order to do so, Matlab has been used. The results are k=-2.7004 and λ=7.9093.
With the previous equation, the exceedance probability of any wind speed can be obtained. Consequently, it is easy to calculate the number of days per year in which a wind speed is reached or exceeded. With these results, the average wind exceedance curve can be drawn, which is in Figure 4.
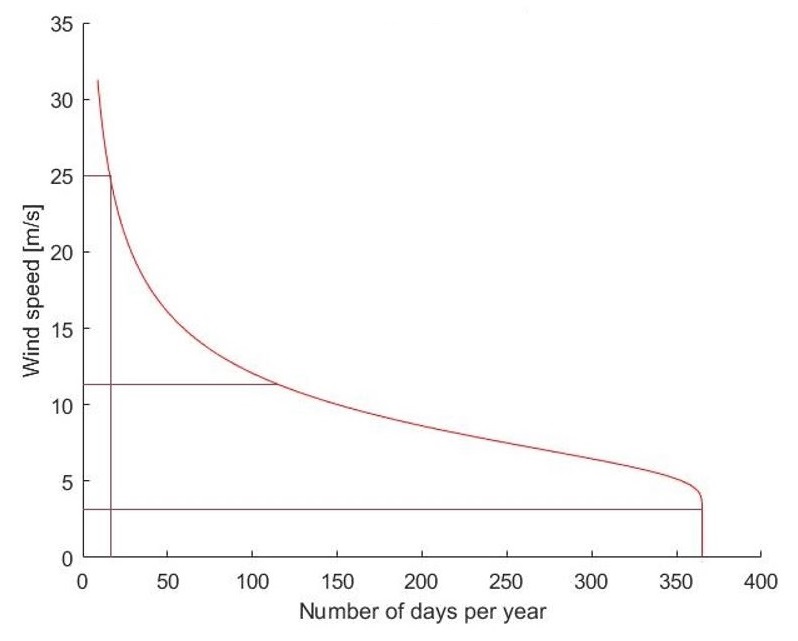
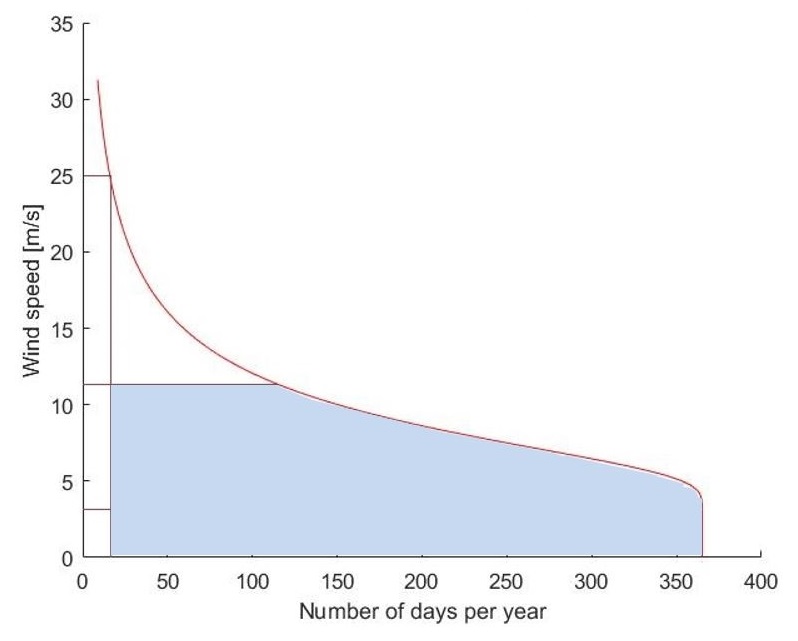
The horizontal lines shown in the graphic correspond with the cut-in, rated and cut-out speeds of the turbine, as shown in the table above. In order to calculate the average yearly energy output, it is necessary to calculate the area comprised:
- below the horizontal line for the rated wind speed (11.4 m/s)
- below the exceedance curve
- to the right of the vertical line for the number of days in which the cut-out wind speed is exceeded
- to the left of the vertical line for the number of days in which the cut-in wind speed is exceeded
- above the horizontal axis
This is the blue area in Figure 5.
The area can be calculated through integration, and the yearly average power output will be obtained. The result is in the table below. This number is important by itself, since it shows how much energy can be generated from the wind part of our device. However, it is also interesting to check if the chosen turbine is adequate for the wind conditions in this location. The average power produced by the turbine can be obtained by dividing the total energy (in MWh) by the number of hours in one year. Dividing the rated power of the turbine (5 MW) by the average power, the capacity coefficient will be obtained. This result has also been included in the table below:
| Annual average wind energy generation |
Capacity coefficient |
|---|---|
| 23890 MWh | 54% |
One possible interpretation of the capacity coefficient is the percentage of time in a year in which the turbine is generating its rated power. Therefore, it could be thought that the higher this value, the better. However, high values of the capacity coefficient usually mean that a higher rated power turbine could have been chosen, giving as a result a greater amount of generated energy. The decisive factor in this cases is the financial analysis, because greater turbines imply normally greater expenses, which may be compensated by a higher benefit due to the additional electricity generation.
Comparing this capacity coefficient to that of other wind farms [4], it can be argued that 54% is a high value. If the turbine had a greater rated power capacity, it would probably have a higher rated speed, meaning that the capacity coefficient would be lower, and more realistic. However, it is convenient to remember that one of the reasons for choosing this wind turbine is the available information that can be found about it. If a commercial 8 MW had been chosen, then the structural and financial analyses we have performed would suffer from an important lack of detail.
Conclusions
In this part of the project, the wind turbine has been chosen, and the wind resource in our location has been analysed. The choice of a wind turbine model has been determined by the usage of this model in several research projects, and also by the amount of information available about it. Regarding the wind resource analysis, a statistical mean values distribution adjustment has been performed in order to obtain reasonable values of energy generation in our chosen location.
The results obtained in this section have been important for developing the rest of the sections, since the energy generation gives an idea of the performance of HOWaT, in case it was a real device. Due to the nature of the device, the results shown here must be complemented with those explained in the tidal concept page.
- Jonkman, J., Butterfield, S., Musial, W., Scott, G. (2009). Definition of a 5-MW Reference Wind Turbine for Offshore System Development. Available online
- Met Office Website
- Ben Amar, F., Elamouri, M., Dhifaoui, R. (2013). Transposition of wind measurements to a standard site of open area roughness at a height of 10m above ground level
- Energynumbers.info (2017). Available at http://energynumbers.info/uk-offshore-wind-capacity-factors [Accesed 01 May 2017]