Stornoway Analysis
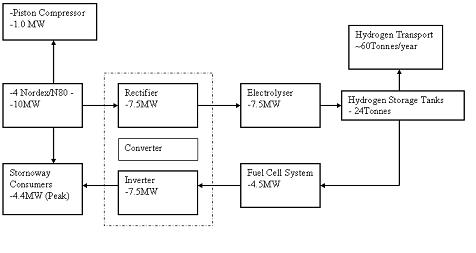
Fig. 1: Wind farm and Hydrogen Buffering System
System Architecture
Above is the energy system that was designed and simulated. It is a wind farm and a hydrogen buffering sub-system. The Hydrogen Buffering sub-system consists of the Electrolyser, Fuel Cell and Hydrogen Storage tanks.
The system works by generating wind power from four 2.5MW N90 turbines. This power is rectified from AC Power to DC power by the rectifier and is used to enable the electrolyser produce hydrogen. The remaining wind power goes to the Stornoway consumers. There is excess electricity generated by the N80 turbines (which would usually be dumped). This excess electrical power is used by the piston compressor to compress hydrogen generated by the electrolyser for storage at 700bar. The DC power from the rectifier is used to generate Hydrogen in the Electrolyser. This hydrogen is used to create Buffer power by the fuel cell.
Buffer Power
The HOMER software simulates a Power Control System that makes the Buffer power available to supplement the wind power when the demand exceeds it. To do this the DC power is inverted (converting the DC power to AC power) for the Stornoway consumers.
Electrolyser power demand is also met by the fuel cell system’s buffer power. This is made possible by using an energy dispatch strategy. We deployed a load following strategy which forces the Fuel cell to provide buffer power to match the demand from either the Stornoway consumers or the Electrolyser or both.
Inputs and Outputs
The Homer software has unique inputs and outputs. These were exploited to achieve our technical objectives.
The inputs are the Load (Stornoway Demand), Components (such as the Nordex N90 turbine, Alkaline Fuel Cell, Converter, Hydrogen Storage tanks and Alkaline Electrolyser), Wind Energy Resource, System Control and System Constraints.
The technical outputs presented in this case study, include the seasonal and annual electrical energy balance which shows the energy generated and consumed by each system component at different efficiencies. The round trip efficiency was computed as a product of all the component efficiencies.
Initial Conditions
For the simulation, all components were modelled according to current technologies available in the market. The wind (see figure 2) and electrical data prepared in 2008 was acquired from the UK office for Business Enterprise and Regulatory Reform [www.berr.gov.uk/files/file45726.xls]. The simulation had to have some control and constraints to enable us achieve our objectives.
The simulation had to be executed with these constraints in mind, one of which was a 35% Operating reserve. This means the system must operate with a surplus power capacity that would be immediately available for a 35% change in the wind power output. This is very important because the wind resource is subject to high intermittence as is evident from the turbines capacity factor of 32.6% and the wind data in the following graph.
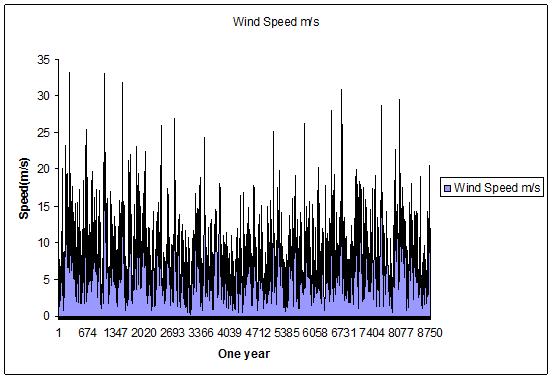
Fig. 2: Wind Data for Stornoway (Sgurr Energy)
Demand
According to the BERR (UK Office for Business Enterprise and Regulatory Reform) the annual average electrical energy demand for our case study location was 5397kWh. We assumed we would be meeting the demand for 2000 homes.
Therefore,

The peak power value of the load at 30MWh/day was 4.4MW. Below is a seasonal profile of the demand simulated over the course of one year.
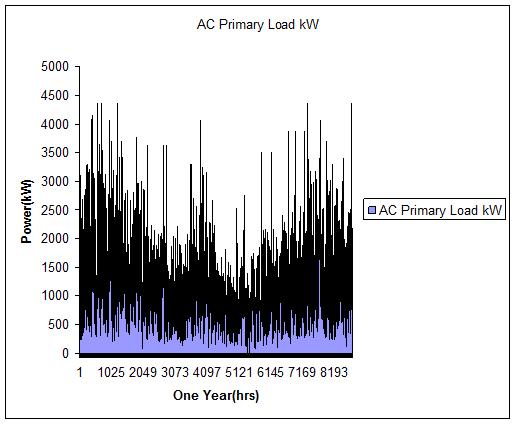
Fig.3. Annual Electrical Energy Demand Profile for Stornoway
Observe that the demand peaks in the winter months, early summer (June) and late autumn (November). The mean annual average power is 1.3MW with a daily high of 2.2MW and a daily low of 500 kW.
Supply
The wind resource in the western Isles is very rich with gales occurring in ten months of the year simulated (see figure 2). The Autocorrelation factor is quite high at 0.924, signalling the dependence on wind from every previous measured hour is high as well. Also, the diurnal pattern strength is very low (0.0382), this means that the wind speeds do not depend on the time of day. (Note: wind is dependent on the solar radiation. That is why there are high wind speeds in the afternoon).
Wind Power (Nordex/N80 Wind Turbines)
The wind turbine was simulated to operate within the technical specifications of the Nordex N80 (2.5MW) WECS. We tried to model the Power curve (see figure 4) to match the original N80 [http://sales.nordex-online.com/N90/N90-1-power-curve-en.pdf]. The Energy system was simulated with 4 Turbines to bring the system’s total capacity to 10MW.
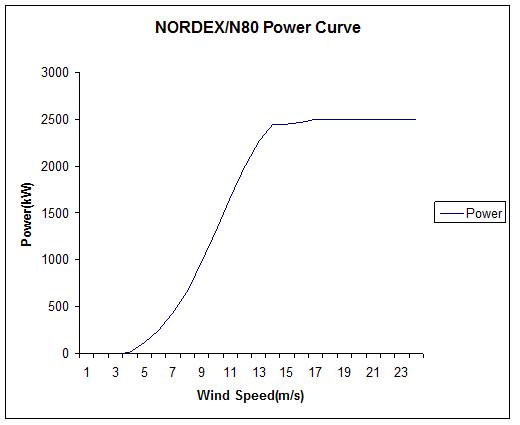
Fig. 4: Power Curve for the N80
Fuel Cell Power (Alkaline Fuel Cell System)
To guarantee uninterrupted supply, a fuel cell system size of 4.5MW was chosen to provide buffer power that would match the peak power demand of 4.4MW.
The Alkaline Fuel cell system was simulated with a parallel connection in mind for a total capacity of 4.5MW. This configuration would allow for a larger current draw and more efficient energy transfer down the cascade of fuel cells. The system was modelled to handle a 30% load ratio (this means the system will operate at a minimum allowable load of 1350 kW) at 65.6% mean Electrical Efficiency.
Converter
The converter was simulated with Rectifier and Inverter components. These components were modelled to have a total capacity of 7.5MW each. They convert the AC Power from the Doubly Fed Induction Generator (which is present in a Nordex/N80) to DC Power for the Fuel Cell.
The Rectifier was modelled to operate at 95% efficiency which is the current efficiency of Silicon Controlled Rectifiers. These rectifiers are designed with IGBT’s (Insulated Gate Bipolar Transistor), which are very efficient as a result of their ability to switch power. They are well suited for Wind Power scenarios where there are heavy variations in the input power as a result of intermittence. The inverter also operates at 95% efficiency.
Below are converter activity charts for the simulation. From these activity charts, it was observed that more power was rectified than was inverted. This rectified power is used by the electrolyser to generate Hydrogen from the fuel cell. This is also significant because the Hydrogen Buffering System consumes more electrical energy than the Stornoway consumers.
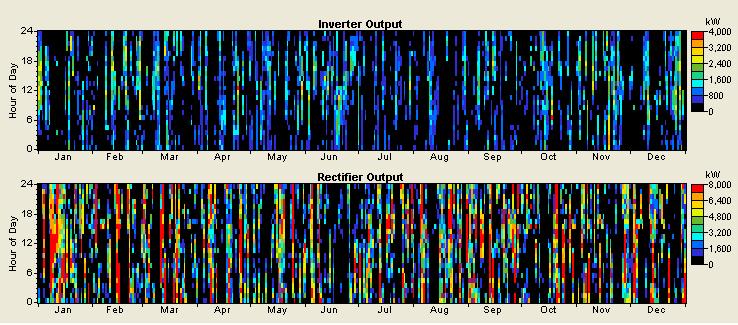
Fig.5: Converter Annual Power Data
Electrolyser
The Electrolyser is modelled after the Alkaline Electrolyser, operating at 59.1% (the efficiency based on the Lower heating Value of Hydrogen). The total capacity of the electrolyser is 7.5MW. Below (in figure 6) is the Hydrogen generation data for the simulation period, we were able to simulate an electrolyser that was able to provide Hydrogen for the Fuel cell and still have a surplus to meet our transport objective. The electrolyser is the primary source of the hydrogen for the fuel cell and the hydrogen public transport system. It is also the largest consumer of electrical energy in the whole system.
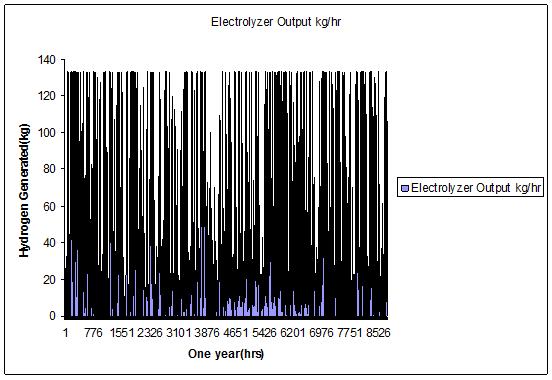
Fig. 6: Hydrogen Generation Data
Hydrogen Storage Tanks
The hydrogen tank that was chosen as the optimum size for this system is 24Tonnes. It was filled to an initial level of 12Tonnes to enable the fuel cell to provide buffer power at the start of the simulation. This was done to prevent a capacity shortfall, enabling the system meet all energy demands at the start.Figure 7 shows the total hydrogen generated by the system, and the surplus that was consumed by the public transport systems (i.e. the fuel depot).
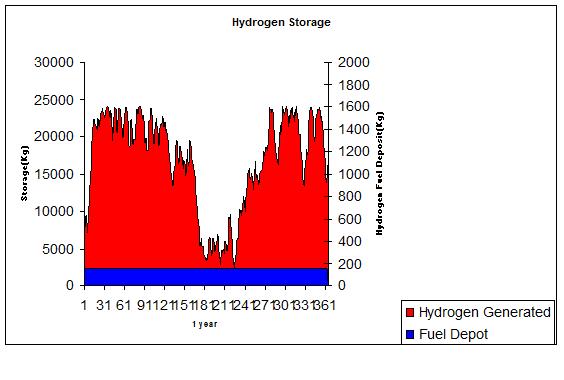
Fig. 7 Hydrogen Storage for the Fuel cell and Public Transport
Hydrogen Surplus for the Transport Potential
The hydrogen surplus was modelled as a hydrogen load that would require a 152kg/day deposit to meet the demand of 2 Hydrogen Fuel Cell Buses (see blue series of figure 7. For guaranteed supply, the depot was programmed to be filled at 1500hrs (3pm) everyday, which is the time during which the highest wind speed occurred based on the wind data
Compressor
The compressor deployed in this system is a 1MW piston compressor powered by the 11.7% Excess Electricity generated by the system (Note: this surplus energy would have been dumped in a conventional system). The work done by the compressor was modelled with Excel, using the formula below:
WTH = [γ/ (γ -1)] * Z * RH2 * To * [((p1/ p0) ^ (γ -1)/γ) - 1]
(WTH is theoretical work at 85% Efficiency)
The following parameters were used to calculate the work:
Y=1.4
Z=1
RH2=4.124 kJ/kgH2.K
P1=350 bar
(Z is the Hydrogen gas compressibility factor at 20 degrees C and 1.013 bar)
Final Results
We were able to establish an energy balance to account for the energy produced and consumed in this Energy System, see Figure 8.This system’s round trip efficiency was then calculated using the formula below:
![]()
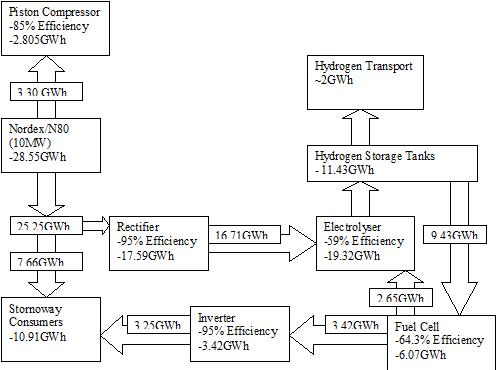
Fig.8: HYDROGEN BUFFERING SYSTEM-ENERGY BALANCE
The Hydrogen Buffering Energy System has a loop in the energy flow (figure 8) to enable the system provide buffer power. The loop that provides buffer power to the electrolyser is the major cause of the low round trip efficiency of the system. The input Energy from the rectifier is 16.71GWh. This energy is used to generate hydrogen in the electrolyser at 59% efficiency. This hydrogen is consumed by the fuel cell and is used to provide buffer power at 64% efficiency to the Stornoway consumers and the electrolyser (see figure 9). The Buffer power it generates is 6.07GWh, which is 36% of the power that was initially rectified.
Seasonal Variation Impact on System Operation
The seasonal variations have a strong impact on the system as Energy Demand varies from season to season. The system we simulated was able to react to these changes effectively by properly matching the energy supply to the energy demands of the electrolyser and Stornoway consumer.
Summer
During the summer months the load following dispatch strategy was able to match the average summer demands of 2088kW for the electrolyser and 964kW for the Stornoway consumers (figure 9) with 2494kW of Wind Power and 714kW of Fuel Cell (Buffer) Power (figure 10).
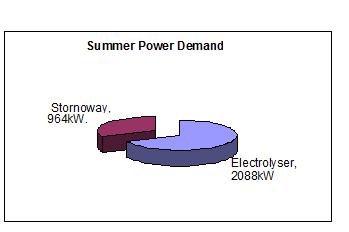
Fig. 9: Stornoway and Electrolyser Demand in the Summer
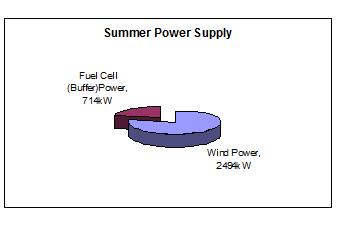
Fig. 10: Fuel Cell and Wind Power (N80) Supply in the Summer
During the summer period 506kW of Excess Electricity is generated from the wind turbines which is not dumped, but used to generate power for the piston compressor.
Winter
During the winter the Average Demand of the Stornoway population increases as expected as more power is consumed for heating purposes. During this season, the load dispatch strategy was used to generate 690kW of Fuel cell (Buffer) Power to supplement the 3998kW of Wind Power generated to meet the demands of 1566kW for the Stornoway consumers and 2333kW for the electrolyser, see figures 11 and 12.
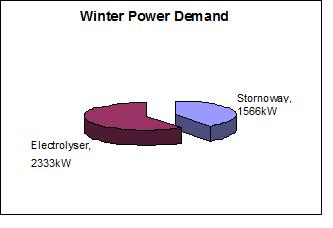
Fig. 11:Electrolyser and Stornoway Demand in the winter
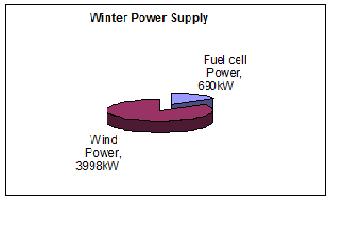
Fig. 12:Fuel cell and Wind Power (N80) Supply in the winter
There is actually an 11% and 39% increase in the Electrolyser and Stornoway Consumer demands respectively. The system also generated 658KW of Excess Electricity in the winter.
Annual Electricity Production
Annually, the best system simulated met all our aims and objectives according to the criteria set out in the aims section. This system had 0% capacity shortfalls all through the year because the components and load dispatch strategy for the simulation was able to adequately supply energy when demanded to meet the Electrolyser or Stornoway needs. Below are pie charts of the total electrical production. 28.5GWh of Electrical Energy or 82% of the annual power supply was generated by the 4 N80 turbines for the year simulated and 6.07GWh was generated by the fuel cell system, see figure 13
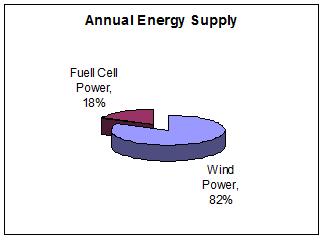
Fig. 13: Annual Energy Supply
In figure 14, 19.32GWh was consumed by the Electrolyser amounting to 64% of the total energy demand on the system per year. 10.91GWh was consumed by 2000 Stornoway homes during this period.
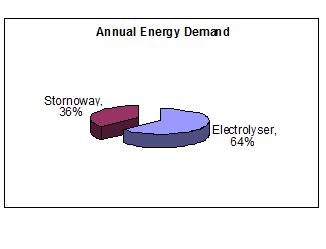
Fig. 14: Annual Energy Demand
The Excess electrical energy (over system rated capacity) that was generated, amounted to 4.05GWh which was not dumped, but used to power the compressor.