Introduction
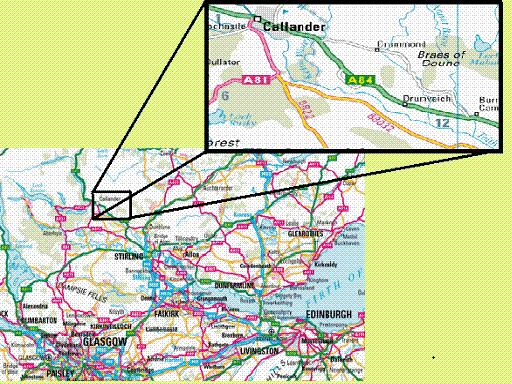
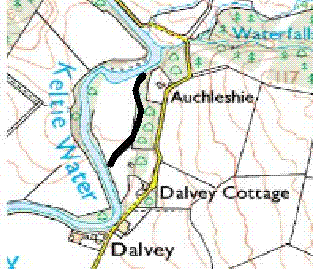
Site 1, Auchleshie, comprises of three residences, Auchleshie cottage, Dalvey Cottage and Dalvey Farm (however it is no longer a functioning farm in terms of energy consumption). These buildings can be found on the Baillie-Hamilton private estate, The Gart Estate outside Callander. The black line on the picture below denotes where the old mill way lies. The mill that no longer exists, stopped working some time ago and evidence of its precise location is difficult to find. It was built in the later half of the 1800s and was used for grinding wheat.
Auchleshie – Mission
“To produce a complete hydro feasibility study of the Auchleshie site in order to determine the options for installing a small scale hydro system to help the Baillie-Hamilton’s achieve their goals of self sustainability”.
First step was to survey the area using tools such as theodelites from the civil engineering department.
However none of the team was experienced using the surveying equipment and so we undertook a course organised by the civil engineering dept at the University of Strathclyde.
This was instructed by Alex Brown and lasted a day.
After, we were able to borrow the necessary equipment and take the data that was required.
Below are the results from the survey.

Supply
The next step is work out how much energy is available from the river. This was done by contacting various sources to find the rainfall in the specific area. Rainfall data was sourced from the met office, which came at daily intervals over the last 6 years. With the rainfall data calculations could be done to estimate the annual direct flow rates in the river(please see excel sheet below). Then we used that direct flow to create the hydrograph for that area for the last 6 years.
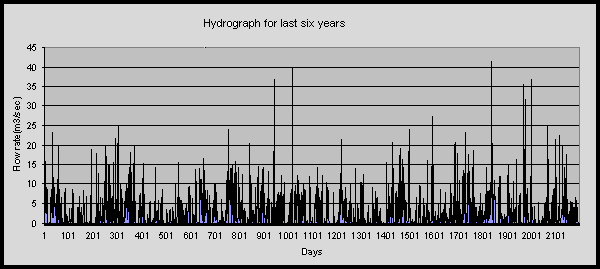
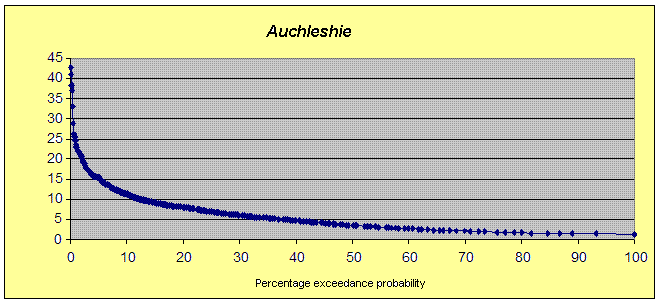
After using the hydrograph and the “straight line” method we calculated the base flow of the river. Finally we calculated the total flow of the river adding base and direct flow together. So now using the total flow of the river and with the appropriate method (please see excel sheet below) of creating flow duration curves we calculate the F.D.C for our river in that specific area for the last 6 years. The FDC for this site is shown below. We can see at what percentage of the year the expected flow rate will be. The catchments were found by two methods. Firstly, we were given figures from the Institute of Hydrology, Warrington. Then by means of acquiring ordnance survey maps we estimated the catchments areas ourselves and then correlated the two answers to find a usable result.
Demand
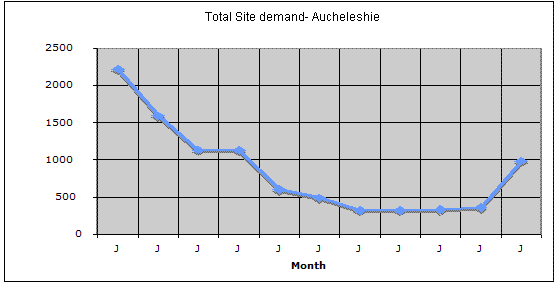
Separately from the supply there is a need to work out the expect demand from the load and to see what turbine is best to match the supply results with demand. The most accurate way to work this out was to investigate the energy consumption of the three residence buildings by hunting out the energy bills. We found the energy bills for both the heating and the electricity over two years. The heating of the homes are produced by oil boilers and therefore energy units needed to be converted into kWh for calculations. To work out the energy consumption over the year averages were taken and also degree-days which gave us more than enough detail for the conditions from which to select the turbine. The trend for the combined energy consumption of the three residences is shown below.

Turbine Selection
The turbine selected at the moment is the Toshiba e-Kid M model. This is subject to change. When looking at the expected power the British Hydro Association use a formula known as “water to wire” which works particularly well with small scale hydro systems, such as our ones. The formula is as follows.

By using the above formula we could insert the results from the data such as Flow rate (Q) and Head (H). This would then gives us the expect power that would be produced by the turbine. The equation also takes account of all assumption such as frictional losses of the turbine at a rate of 70% very conservative. This leads the results to be on the safe side and therefore power would be expected to have an error of positive 1-3% but not anything less. After working out the power we can then use the three variables as criteria conditions for choosing the turbine. The way that we selected the turbine was to find as many turbines that fitted within those criteria conditions. Then we narrowed down the selection by choosing only those turbines that can either produce enough power to match the demand or be as close to it as possible. This gave us the short list we needed and then chose the Toshiba e-Kid M based on its competitive price and the design of the system.
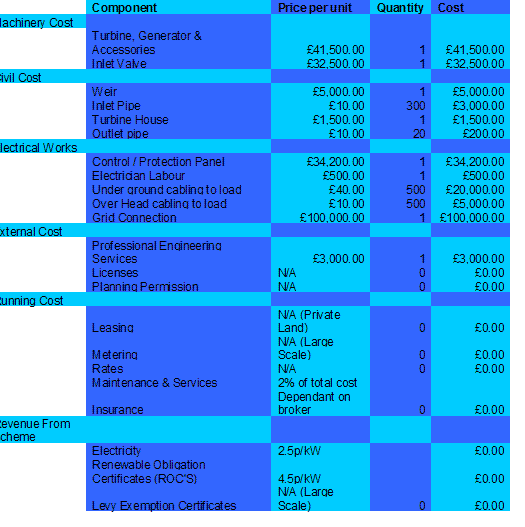
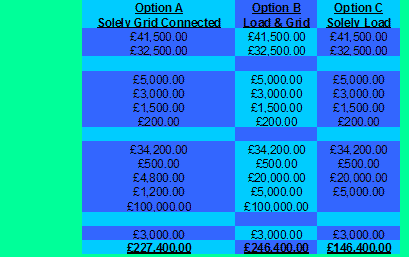
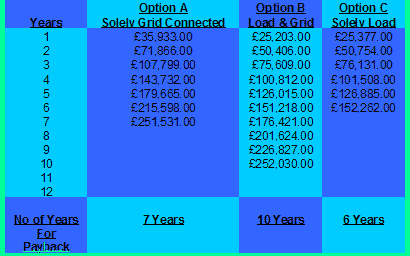
Costing
