


|
|||||||||||||||||||||
|
|
||||||||||||||||||||
|
The Concept
The OTEC-Ammonia Closed Cycle
The Conventional Power Plant Steam Cycle ĀĀĀĀĀ
The above diagram depicts the Combined Cycle Gas and Steam Plant in India, this is common to many power stations around the world. Alternatively the Gas Cycle will be replace by a Coal/Oil Furnace or Nuclear Reactor to provide the heat to the Steam Cycle. The exhaust gases from the Gas Turbine Plant enter the Heat Recovery Steam Generator where feed water, pumped from a de-aerator by means of feed pumps, is turned into steam, superheated and expands in a 2 stage steam turbine rated at 130MW.Ā The expanded steam enters the condenser where circulating water condenses the steam into saturated water at vacuum pressures.The condensate is then pumped back to the de-aerator and the cycle repeats.TOP Practical Limitations of The Steam Cycle
The purpose of the OTEC integration with Steam Cycle is not only to boost up the overall power output but also the overall cycle efficiencies. This is only possible if the design limitations of the Steam Cycle are honoured. If these limitations are exceeded it will result in a overall reduced output due to the fact that the reduction in steam cycle output would exceed the additional OTEC output. The limiting design factors of the Steam Cycle when concerned with OTEC integration are Condenser back pressure(vacuum) and its saturation temperature which are fixed by designĀ for optimum steam cycle output. The difference between the temperatures of condensate and the cooling water leaving the condenser known as Terminal Temperature Difference (TTD), which has a minimum limit that is fixed by design for maximum steam cycle output. The TTD is the minimum difference possible between the cooling water exit temperature and the steam condensing temperature, for optimum performance of the cycle.TOPThe mass flow of the condenser cooling water pump has a maximum limit which is fixed by the pump power rating. Below still pictures of the workbooks used in this model are shown. For the purpose of actually using and developing the our mathematical model the hyperlink here allows the workbook to be downloaded or opened in excel. Open work books
Above you can see a still shot of the experimentation tool that we have developed. It consists of the basic OTEC-Ammonia closed cycle, the governing thermodynamic equations, the corresponding assumptions, interpolation calculators, and the integrated system with a conventional power plant, where the OTEC system replaces the Cooling Towers/Canals. In Excel this tool works within four sheets, and these sheets are linked via Excel formulae. The operation of the OTEC cycle can be altered in the calculator section (sheet 3) to suit the individual assumptions of the experiment to be carried out. Once the function of the cycle has been designed, the experiments can be conducted on the schematic diagram itself either for the OTEC only cycle or for the combined system. In addition, a calculator for the Steam cycle has also been developed (sheet 4), this allows the user to make changes to the operation of the Steam Condenser when doing more advanced experiments.TOP When conducting the experiments the parameters highlighted in blue are the fixed design parameters for a particular case and are manually entered on the schematic diagram. The Workbook will then automatically calculate all the other parameters and display them highlighted in red. The result box on the schematic diagrams displays the Power output and thermal efficiency. To optimise the OTEC-Ammonia cycle to give the maximum Power output, the Condensing temperature TC , should be varied. This is highlighted in pink on the schematic. The condensing temperature is the temperature of the Ammonia at which it will change phase from a vapour to a liquid. By changing this temperature, the corresponding saturation pressure, enthalpy, and entropy will change automatically within the workbook. This in turn will effect the amount of power produced in the turbine because the turbine output is governed by the enthalpy change across it, (points 2 to 3 on schematic). The Condensing temperature also governs the Power required for the Cold Water Pump, sinceĀ the mass flow of the cold water must also change to supply a sufficient condensing effect. The Net Power from the cycle is defined as the Gross Power minus the Total pumping Power. Therefore since the change in Gross power and Pumping power with respect to changes in the condensing temperature is occuring at different rates, there will be an optimum case where the Net Power is at a maximum point. Experiments using this workbook can be carried out using data for any Conventional Power Station for the combined system, and for any suitable warm/cold water source for a stand alone OTEC system. An electronic copy can be made available for further development through the æEnergy Systems Research Unit, University of Strathclyde or by downloading from this site below the Model title. TOP The following list identifies the simplified assumptions used within the current Workbook: For OTEC-Ammonia Cycle 1.Steady State conditions are assumed throughout this analysis. 2.The Power required for the warm water pump is not included in the calculation for the Net Power output. 3.There is no temperature change of Ammonia across both the Evaporator and the Condenser, only a phase change. 4.Ammonia exits the Evaporator as a saturated vapour with no degree of Superheat. 5.Ammonia exits the Condenser as a saturated liquid with no under cooling. 6.The mass flow of the warm water source is limited by the size of the existing pump in the steam cycle plant. In the case of the power plant in India the pump is rated at a maximum ofĀ 7222 kg/s. 7.The dimensional limitations of the Evaporator and Condenser are not considered. 8.The Turbine operates with an expansion efficiency of 0.85, which is attainable in current turbine technology. 9.The change in temperature across the Ammonia pump is taken as zero. 10.Pump efficiencies are taken as 0.7.For the Steam Cycle at the Indian Power Plant Steady State conditions assumed throughout this analysis. For the steam cycle at the Indian Power Plant: 11.Steady state conditions assumed throughout this analysis 12.Design values of Steam Cycle in the Combined Cycle ( Gas Turbine+Steam Turbine) Indian Power Plant are based on ISO conditions on Gas Turbine Plant. (ISO- Amb Temp-28oC, RH-60%, Freq-50Hz) class=MsoBodyText> 13.A simple steam cycle considered for analytical purposes. 14.The power output of the gas turbine is omitted for calculating efficiencies. 15.Also feed heating, de-aerating and condensate pumping power not considered. Steam flow increased by 30 T/hr from design flow to compensate for these omissions to get the design output. 16.Isentropic efficiency of Steam Turbine assumed at 85%. 17.All pump efficiencies within the Steam cycle are assumed to be 85%. Characteristic Assumptions Each result set graphically displayed below contains three different cases, realistic, optimistic, and extreme. This will give a good reference to compare and discuss the results with the assumptions made. These characteristic assumptions mainly concern the heat exchanger temperature differences possible due to technological limitations with low-grade heat transfer. The realistic case considers a low temperature difference across the respective heat exchangers, as has been the case with previous OTEC experimental Plant Ships around the world. The optimistic case considers ideal temperature differences across the heat exchangers. The extreme case considers the maximum possible temperature of the warm water source combined with the lowest possible cold water temperature, and the maximum warm water mass flow available. This maximises the OTEC unit efficiency The following table outlines these specific design assumptions. Refer to the spreadsheets shown in the Model section above for a Nomenclature of the various sysmbols used TOP
Source Data The following table displays the data we have obtained to assist with the experiments:TOP Power Plant in India
Ambient temperature changes in a typical year at the Power plant in India
Data Obtained from Longannet Power Station, Fife, Scotland, UK
Set 1: Analysis of Steam-OTEC Ammonia cycle integration, with the plant design of the NTPC Combined Cycle Gas Turbine Plant, in Kayamkulam, India. Before experimenting with the integrated system, the operating temperatures of the working fluid (Ammonia) within the OTEC cycle requires optimisation to produce the maximum power output, for a given source of warm and cold water. This is simply done by fixing the Evaporation temperature TE to the maximum permitted, based on the Heat Exchanger assumptions, and then by varying the Condensing temperature within an appropriate range to find the exact temperature that will give the maximum Net Power result. From the assumptions section you will have seen that three different
cases are considered for comparison purposes for each set of experiments,
namely realistic, optimistic, and extreme. The realistic case considers
using heat exchanger temperature differences based on the current
technology available, combined with a cold water temperature of 15oC.
The optimistic case considers using a more ideal heat exchanger temperature
difference that is not yet technologically available for such low
grade heat transfer, combined with a lower cold water temperature
of 12oC. The extreme case considers using a cold water
temperature of 4oC, which is the lowest available in the
oceans, this is combined with using the maximum pumping power possible
of the existing pump within the conventional power plant. For a more
detailed description of these design parameters, see the table in
the assumptions section above. ĀA temperature of 40oC
was used as the warm water temperature supplied to the OTEC cycle
for optimisation purposes. To understand why the curve relationship
occurs refer to the model description in section 2. The main aim initially
is to find the optimum Evaporation temperature TEand the
corresponding Net Power output, which can clearly be seen in chart
1 below. As you can see the maximum power achievable for each case varies considerably. Between the extreme case and the realistic case, a drop in power of around 84% occurs, and between the optimum case and the realistic case, a drop in power of around 66% occurs. Since the mass flow of the warm water and all the parameter relationships for each individual case remain fixed, this optimum value of TE Āstill remains appropriate for changes in the temperature of the warm water source. At different times of the year local ambient
temperatures will change depending on the natural climatic seasonal
changes. This has a direct effect on the temperatures of the warm water
supplied to the OTEC plant since the warmer the water entering the condenser
in the steam plant the warmer the water leaving the condenser in the
steam plant andon to the otec plant. We have assumed that a temperature
difference of 8oK is maintained across the Steam Cycle Condenser
with respect to the inlet cooling water temperature, which is in turn
governed by the local ambient temperature. This means that as ambient
temperature changes the warm water source for the OTEC plant will vary
accordingly. Experiments to show how this effects the Net power from
the OTEC plant, found that as the ambient temperature increases the
OTEC Net Power also increases to a maximum level defined by the terminal
temperature difference of the Steam Cycle Condenser. This is shown on
chart 2. The OTEC-Ammonia plant output when integrated
with the steam cycle output can be seen in chart 4
This table shows the maximum increase possible for Combined thermal efficiency, with respect to an optimum efficiency of 34.38% of the Steam Cycle when operating independently. These increases may appear to be insignificant, however slight improvements in the thermal efficiency of the Steam cycle working at optimum conditions at this level could be seen as a worthy achievement, although this will probably not be economically viable based on the current economic situation with OTEC technology.TOP The
results of a more advanced experiment showing how changing the Terminal
Temperature Difference (TTD) of the Steam Cycle effects the Net Power
output, can be seen in chart 6 In contrast to the Power Plant in India, an analysis on a Power Station based in a colder climate will give an interesting comparison and open this idea for a feasibility study in climates of higher latitude. Longannet power station consists of 4 coal-based units each rated at 600MWs.There are two turbines in each unit separately mounted with respective individual condensers. This power station obtains condenser-cooling water from the River Forth and passes the warm water through a cooling canal before being discharged into the river, which is essentially an open loop cooling cycle. TOP Before entering the cooling canal the water is at a maximum temperature of 14.3oC, this is well below the required temperature needed for OTEC operation. Alternatively applying the OTEC integration as a closed loop cooling system, as has been done for the Indian power plant, allows the temperature of the Steam Cycle coolantĀ to be increased to a maximum temperature of 26oC, thus ideal for OTEC operation. This analysis considers using the existing Power Station design with the exception of the Condenser, as a plan for a new build Power Plant at a location where cold water of 4oC is physically obtainable. The adapted condenser is assumed to be re-designed to give the required heat transfer for this application. At Longannet the Steam Condenses at 29oC, and assuming that the terminal temperature difference (TTD) is 3oK, an exit cooling water temperature of 26oC can be achieved. We have also assumed that the existing temperature difference of 7oK between the inlet and outlet temperatures of the cooling water is still valid in this application. The analysis we carried out only considers one instant in time, and assumes that the local ambient temperature will be sufficient to permit the temperatures of the Steam Cycle cooling water.Ā Two cases(realistic and optimistic) have been analysed in a similar fashion to the Indian Power Plant analysis, with the extreme case being omitted. The results are displayed in the following tables: For the OTEC-Ammonia Cycle only
For The Combined Steam-OTEC Cycle
It can be seen that for the optimistic case an increase of 10.8 MW is achievable giving an increase of 0.69% in the overall thermal efficiency of the Steam-OTEC integrated plant. For the realistic case an increase of 4.2 MW is achievable, giving an increase of 0.27% in the overall thermal efficiency. The Net Power is significantly larger than that found from the analysis carried out with the Indian Power Plant. This is due to the mass flow rate of the coolant water increasing in size by a factor of six, as Longannet is a much larger Power plant, and therefore requires more coolant water. This power output is quite substantial, and if it could be maintained throughout a year with little fluctuation, the realistic case could provide 36.8GWhr of electricity. In financial terms based on a market value of 3 pence per unit of electricity, this energy could effectively raise Ż1.1 million of revenue. However this analysis is highly hypothetical and optimistic and doesnÆt consider at all the fact that local ambient temperatures in Britain may not be able to substantiate such temperatures of the Steam Cycle Cooling water. Furthermore, the cold water temperature of 4oC may also not be obtainable along the coastline of Britain without installing a pipe many tens of kilometres out to sea to get a sufficient depth, due to the size of the continental shelf. With this pessimistic view point in mind, these results give an optimistic starting point for further analysis.Ā TOP Results Summary Table
Environmental Impact of The Cold Water Discharge The following table shows the monthly average surface water temperatures at the respective countries:
This hypothetical thermodynamic study considers replacing the existing cooling system of conventional power plants both in India and in Scotland, with an OTEC-Ammonia cycle as a closed loop cooling system. As we have discussed already an additional cold water source is required. This holistic system assumes that the design of the Power Plants we have investigated can be adapted to accommodate the addition of the OTEC cycle when considering a new build Power station at a location with economic access to the respective cold ocean water required. The following table shows how each of the discharge temperatures compares with the mean surface water temperature for each case. TOP
With respect to the realistic cases, discharging water to the surface of the nearby ocean by up to 5.25 degrees above the temperature of the surface water at these flow rates, would probably not have any serious environmental impact. Although to minimise the thermal impact completely the discharge water would need to pass through Cooling Canals to reduce the temperature to match that of the surface water temperature. This would be enforced by Environmental Legislation if the cold water source was from a river, lake,or estuary as the eco-structure is smaller and more sensitive to temperature fluctuations, when compared to the dilution of the discharge with vast volumes of water in the ocean.Ā In these circumstances the discharge water temperature is required to be equal to the temperature of the intake water. For example, at Longannet Power station the existing Cooling system pumps water from the River Forth at 7.4 oC, and the exit temperature from the actual Plant is at 14.3 oC. This is then cooled in a Cooling Canal back to a temperature of 7.4 oC, as a requirement of Environmental Legislation enforced by the Scottish Environmental Protection Act (SEPA). If regulations regarding the temperature limits of thermal discharge water were not adhered to, then there would be an impact on the local aquatic environment, mainly concerning marine organisms and the reduction in dissolved oxygen that effects fish respiration. Like most Environmental Impact assessments this is entirely site specific, and due to time constraints, we have not investigated the location of suitable sites or an in-depth environmental analysis within this study.TOP ConclusionsAn Engineering design, thermodynamic analysis, optimisation and simulation of an OTEC power plant integration with two separate conventional fossil fuelled power plants was carried out in this project. This involved using the OTEC plant as the cooling system, replacing the existing towers or canals, and in turn achieving additional power and an overall increase in the thermal efficiency of the Power plant. In India we have shown you that a minimum nominal Net Power increase of 1.56 MW @ 1.95% OTEC thermal efficiency, giving an minimum increase of 0.42% of the thermal efficiency of the combined Steam-OTEC cycle, is theoretically achievable based on optimum ambient temperature conditions. Similarly for Longannet Power Station in Scotland, a minimum nominal Net Power increase of 4.2 MW @ 0.63% OTEC thermal efficiency, gives a minimum overall thermal efficiency increase of 0.27%. These figures are based on realistic heat exchanger assumptions and have been compared with optimistic assumptions showing a substantial difference in performance. A plant simulation was further carried out to study the seasonal variation of ambient temperature for the scenario in India. A large fluctuation was discovered, although 6.23 GWhr will theoretically be produced in a typical year, holistically gaining Ż190,000 of revenue if traded in the British electricity market. Also if the nominal Net Power produced by the OTEC plant when integrated with the Longannet Power Station, could be maintained throughout a year, then 36.8 GWhr of energy could be produced gaining Ż1.1million on the British Electricity market. These figures have been produced based on a total simplification of the system and with steady state conditions. If transient conditions, technical, and geographic limitations were involved then the picture would look very different, but the fact remains that we have shown the potential for this idea in the future. We also found that no additional Environmental impact would occur regarding the discharge of the cold water required for OTEC cooling. The hypothetical experiments conducted as part of this study have several limitations.Ā Some of them have already been enlisted as part of the assumptions, for example the design elements of the Heat Exchangers (OTEC Evaporator and Condenser) such as surface area, overall heat transfer coefficients, number of tubes and size. Also important aspects related to cold water piping such as length and diameter were also omitted. Detailed design of pumping systems (ammonia and cold water) also has been excluded in the present analysis. It would be quite appropriate to include all these aspects in the next part of the study, which could involve an in-depth design of these individual process elements. Then compare these design outcomes with the products already existing in the market.Ā This would pave the way for an economical analysis followed by economic optimisation. Hence the future work should focus on translating the hypothetical model into a practical reality involving not only the detailed design aspects but also the economical optimisation. |
|||||||||||||||||||||||||||||||||||||||||||||||||||||||||||||||||||||||||||||||||||||||||||||||||||||||||||||||||||||||||||||||||||||||||||||||||||||||||||||||||||||||||||||||||||||||||||||||||||||||||||||||||||||||||||||||||||||||||||||||||||||||||||||||||||||||||||||||||||||||||||||||||||||||||||||||||||||||||||||||||||||||||||||||||||||||||||||||||||||||||||||||||||||||||||||||||||||||||||||||||||||||||||||||||||||||||||||||||||||||||||||||||||||||||||||||||||||||||||||||||||||||||||||||||||||
 Conventional
Fossil/Nuclear Power stations use the Steam Cycle as the Power Cycle
of the plant, to provide mechanical power to a Generator, which in turn
produces Electricity. Cold water is used to condense the hot water vapour
in a Heat Exchanger (Condenser) at the exit of the turbine to maximise
the energy conservation. This condensate can then be pumped back to
the boiler, where it gets superheated, thus completing the cycle. The
cooling water will gain on average 8oK as it passes through
the Condenser, removing the latent heatĀ required to change the phase
of the working fluid from a vapour to a liquid. There are two main options
possible for this cooling system, open loop and closed loop. An Open
loop (once through) cooling system pumps water from either the Ocean,
a river, or lake, depending on the geographical location of the Power
Plant. This water then passes through the Condenser before returning
to its source. Due to Environmental Legislation this water must be cooled
to below a certain
Conventional
Fossil/Nuclear Power stations use the Steam Cycle as the Power Cycle
of the plant, to provide mechanical power to a Generator, which in turn
produces Electricity. Cold water is used to condense the hot water vapour
in a Heat Exchanger (Condenser) at the exit of the turbine to maximise
the energy conservation. This condensate can then be pumped back to
the boiler, where it gets superheated, thus completing the cycle. The
cooling water will gain on average 8oK as it passes through
the Condenser, removing the latent heatĀ required to change the phase
of the working fluid from a vapour to a liquid. There are two main options
possible for this cooling system, open loop and closed loop. An Open
loop (once through) cooling system pumps water from either the Ocean,
a river, or lake, depending on the geographical location of the Power
Plant. This water then passes through the Condenser before returning
to its source. Due to Environmental Legislation this water must be cooled
to below a certain temperature before being discharged, this is done via Cooling Towers
or Cooling Canals. A Closed loop cooling system uses freshwater in a
self contained unit, where it is re-circulated back to the Condenser
via Cooling Towers. The function of a Cooling Tower is to remove the
heat from the coolant via convection, radiation and evaporation, and
to dissipate it to the atmosphere. In general Conventional Power Plants
operate with a thermal efficiency of approximately 33%, the bulk of
the remaining 66% is lost in the Condenser, for example a Nuclear Plant
that produces 1000MWÆs of Power will discharge 2000MWÆs as heat loss.
This is another huge untapped thermal energy tank, but due to the low
temperatures involved and often isolated geographical location of the
Plants, this heat cannot be used for anything useful, such as district
heating. However, there may be a solution! . As you will be aware from
reading other pages in this web site, Ocean Thermal Energy Conversion
(OTEC) utilises a temperature gradient of
temperature before being discharged, this is done via Cooling Towers
or Cooling Canals. A Closed loop cooling system uses freshwater in a
self contained unit, where it is re-circulated back to the Condenser
via Cooling Towers. The function of a Cooling Tower is to remove the
heat from the coolant via convection, radiation and evaporation, and
to dissipate it to the atmosphere. In general Conventional Power Plants
operate with a thermal efficiency of approximately 33%, the bulk of
the remaining 66% is lost in the Condenser, for example a Nuclear Plant
that produces 1000MWÆs of Power will discharge 2000MWÆs as heat loss.
This is another huge untapped thermal energy tank, but due to the low
temperatures involved and often isolated geographical location of the
Plants, this heat cannot be used for anything useful, such as district
heating. However, there may be a solution! . As you will be aware from
reading other pages in this web site, Ocean Thermal Energy Conversion
(OTEC) utilises a temperature gradient of  22oK
between warm surface water and cold deep ocean water in tropical regions
to produce electricity. The idea that we are developing in this project
examines the thermodynamic feasibility of using the thermal discharge
discussed above, as the warm water source for an OTEC plant. In essence
OTEC could be acting as the bottom cycle of a Conventional Power Plant,
providing additional power, increasing the overall thermal efficiency,
and as an integrated cooling system to condense the working fluid of
the Steam Cycle. This broadens the scope of potential sites suitable
for OTEC, as thermal Power Stations exist all over the Globe. There
could be a very positive impact on the length and depth of the cold
water pipe required to provide cold water to the OTEC cycle condenser.
For example, in colder climates the surface of the ocean is at a much
lower temperature, thus the temperature required couldĀ potentially
be found at higher depths. Furthermore, in warm climates the cooling
water used in the Steam cycle is at a higher temperature due to higher
ambient temperatures, therefore higher temperatures of cold water can
be used to give theĀ 22 oK difference needed for OTEC operation.
This means that the economics of OTEC installation may be improved by
the huge reduction in the length and Engineering complexities of sourcing
the cold water at much higher depths, and in turn benefit the commercialisation
of this technology. In addition to this, the Power required for the
warm water pump can be eliminated from the calculation of the Net Power
produced by the OTEC cycle, due to this pump already being required
by the Conventional Power Plant to pump
22oK
between warm surface water and cold deep ocean water in tropical regions
to produce electricity. The idea that we are developing in this project
examines the thermodynamic feasibility of using the thermal discharge
discussed above, as the warm water source for an OTEC plant. In essence
OTEC could be acting as the bottom cycle of a Conventional Power Plant,
providing additional power, increasing the overall thermal efficiency,
and as an integrated cooling system to condense the working fluid of
the Steam Cycle. This broadens the scope of potential sites suitable
for OTEC, as thermal Power Stations exist all over the Globe. There
could be a very positive impact on the length and depth of the cold
water pipe required to provide cold water to the OTEC cycle condenser.
For example, in colder climates the surface of the ocean is at a much
lower temperature, thus the temperature required couldĀ potentially
be found at higher depths. Furthermore, in warm climates the cooling
water used in the Steam cycle is at a higher temperature due to higher
ambient temperatures, therefore higher temperatures of cold water can
be used to give theĀ 22 oK difference needed for OTEC operation.
This means that the economics of OTEC installation may be improved by
the huge reduction in the length and Engineering complexities of sourcing
the cold water at much higher depths, and in turn benefit the commercialisation
of this technology. In addition to this, the Power required for the
warm water pump can be eliminated from the calculation of the Net Power
produced by the OTEC cycle, due to this pump already being required
by the Conventional Power Plant to pump the water to the Cooling Towers/ Cooling Canals. Hence the efficiency
of the OTEC plant will be improved. In theory with this integration
of OTEC, the Cooling Towers / Canals could be eliminated from the design
of Conventional Power Plants, because there could be a sufficient temperature
drop across the OTEC cycle. This water can then be re-circulated in
a closed loop or discharged back to the source in a once through system.
Elimination of the Cooling Towers/Canals would reduce the capital cost
of the Conventional Power Plant, but on the other hand new capital costs
would be introduced by the installation of the OTEC plant. The balance
between these two capital costs and the revenue raised from the additional
Power produced by the OTEC plant is another project within itself and
is not considered in any depth within this study. The study that we
have carried out involves the integration of the OTEC Ammonia Closed
Cycle with a National Thermal Power Corporation, Combined Cycle Gas
fired plant in India, and Longannet Power Station in Scotland UK. The
source data from India was gained through one of our team members who
is a current employee of this particular plant, and the data from Longannet
Power Station was gained during a site visit as part of the MSc course
syllabus. The Ammonia closed cycle was chosen for its simplicity and
suitability to electricity production, as opposed to the Open cycle,
that produces a combination of electricity and fresh water. Due to time
and facility constraints a practical laboratory experiment was decided
unsuitable, hence a simulation model was created on Excel that enabled
us to carry out theoretical thermodynamic experiments and gain useful
and interesting results. What we aim to show you is the increase in
Power and thermal efficiency that can be achieved with OTEC-Conventional
Power plant integration, in both warm and cold climates, proceeding
with a results analysis and discussion of the potential feasibility
of this idea, with reference to the assumptions we have made.Ā
the water to the Cooling Towers/ Cooling Canals. Hence the efficiency
of the OTEC plant will be improved. In theory with this integration
of OTEC, the Cooling Towers / Canals could be eliminated from the design
of Conventional Power Plants, because there could be a sufficient temperature
drop across the OTEC cycle. This water can then be re-circulated in
a closed loop or discharged back to the source in a once through system.
Elimination of the Cooling Towers/Canals would reduce the capital cost
of the Conventional Power Plant, but on the other hand new capital costs
would be introduced by the installation of the OTEC plant. The balance
between these two capital costs and the revenue raised from the additional
Power produced by the OTEC plant is another project within itself and
is not considered in any depth within this study. The study that we
have carried out involves the integration of the OTEC Ammonia Closed
Cycle with a National Thermal Power Corporation, Combined Cycle Gas
fired plant in India, and Longannet Power Station in Scotland UK. The
source data from India was gained through one of our team members who
is a current employee of this particular plant, and the data from Longannet
Power Station was gained during a site visit as part of the MSc course
syllabus. The Ammonia closed cycle was chosen for its simplicity and
suitability to electricity production, as opposed to the Open cycle,
that produces a combination of electricity and fresh water. Due to time
and facility constraints a practical laboratory experiment was decided
unsuitable, hence a simulation model was created on Excel that enabled
us to carry out theoretical thermodynamic experiments and gain useful
and interesting results. What we aim to show you is the increase in
Power and thermal efficiency that can be achieved with OTEC-Conventional
Power plant integration, in both warm and cold climates, proceeding
with a results analysis and discussion of the potential feasibility
of this idea, with reference to the assumptions we have made.Ā Warm
water is pumped to the Evaporator where the heat is transferred through
a series of pipes to the working fluid ¢ Ammonia. During normal applications
of OTEC this warm water is taken from the surface of certain areas of
the tropical oceans, but in this application the warm water is drawn
from the condenser of a Conventional Power Plant. The operating conditions
of the steam cycle, and the original temperature of this water at the
source (for open loop cooling systems), i.e. the ocean/river/lake, sets
the temperature of this water, or ambient temperature in the case of
closed loop systems. Cold water is pumped from the ocean through a pipe
at depths where a sufficient temperature exists to give the 22oK
temperature difference between the cold and the warm water source, for
example in India, a 40oC warm water source from a Power Plant
will require a maximum of 18 oC cold water, although 15
oC would be more appropriate to allow for fluctuations in the
warm water temperature. This cold water is passed through a condenser
where heat from the Ammonia is transferred to it, hence raising the
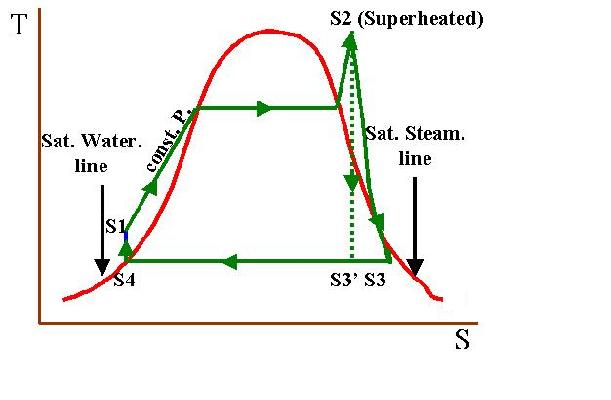
temperature of the water. With respect to the working fluidĀ in this
cycle, the Ammonia exists as a liquid at point 1 (ref. to schematic)
and as this liquid passes through the evaporator at constant pressure
it changes phase to a saturated vapour (point 2). This is due to the
heat transfer from the warm water through the heat exchanging pipe network
within the
Warm
water is pumped to the Evaporator where the heat is transferred through
a series of pipes to the working fluid ¢ Ammonia. During normal applications
of OTEC this warm water is taken from the surface of certain areas of
the tropical oceans, but in this application the warm water is drawn
from the condenser of a Conventional Power Plant. The operating conditions
of the steam cycle, and the original temperature of this water at the
source (for open loop cooling systems), i.e. the ocean/river/lake, sets
the temperature of this water, or ambient temperature in the case of
closed loop systems. Cold water is pumped from the ocean through a pipe
at depths where a sufficient temperature exists to give the 22oK
temperature difference between the cold and the warm water source, for
example in India, a 40oC warm water source from a Power Plant
will require a maximum of 18 oC cold water, although 15
oC would be more appropriate to allow for fluctuations in the
warm water temperature. This cold water is passed through a condenser
where heat from the Ammonia is transferred to it, hence raising the
temperature of the water. With respect to the working fluidĀ in this
cycle, the Ammonia exists as a liquid at point 1 (ref. to schematic)
and as this liquid passes through the evaporator at constant pressure
it changes phase to a saturated vapour (point 2). This is due to the
heat transfer from the warm water through the heat exchanging pipe network
within the  evaporator.
The Ammonia in the saturated vapour state now has enough energy to drive
a turbine specifically designed to work with this fluid. As this energy
is converted to mechanical power in the turbine the fluid expands and
looses energy as its pressure decreases(points 2 to 3). At the exit
of the turbine the Ammonia fluid exists as a wet vapour at low pressure.
To conserve as much of this remaining energy as possible the fluid passes
through the condenser and looses enough latent heat to change the phase
from a wet vapour to a saturated liquid at constant pressure(point 4).
This occurs due to the cooling effect created by the cold water pumped
from the ocean, in the same way as the ammonia was vaporised by the
warm water through the heat exchange mechanism in the evaporator. To
complete the cycle, the ammonia now in a liquid state needs to be pumped
back to the evaporator and to the pressure required for vaporisation
within the evaporator. The operating pressures within the evaporator
and condenser are the saturation pressures at the respective evaporation
and condensing temperatures. These temperatures are highly dependent
on the temperatures of the warm and cold water sources and their respective
mass flow rates. This relationship is discussed in more detail later
in this page. The mechanical power produced in the turbine is then transferred
to electrical energy in a generator. The output of this generator is
the Gross power produced by the cycle. Some of this power is then used
to drive the cold water pump and the ammonia pump, the remaining power
is known as the Net power produced by the cycle. The Net thermal efficiency
is defined as the ratio of the Net Power with the heat supplied to the
cycle from the warm water at the evaporator stage.Ā
evaporator.
The Ammonia in the saturated vapour state now has enough energy to drive
a turbine specifically designed to work with this fluid. As this energy
is converted to mechanical power in the turbine the fluid expands and
looses energy as its pressure decreases(points 2 to 3). At the exit
of the turbine the Ammonia fluid exists as a wet vapour at low pressure.
To conserve as much of this remaining energy as possible the fluid passes
through the condenser and looses enough latent heat to change the phase
from a wet vapour to a saturated liquid at constant pressure(point 4).
This occurs due to the cooling effect created by the cold water pumped
from the ocean, in the same way as the ammonia was vaporised by the
warm water through the heat exchange mechanism in the evaporator. To
complete the cycle, the ammonia now in a liquid state needs to be pumped
back to the evaporator and to the pressure required for vaporisation
within the evaporator. The operating pressures within the evaporator
and condenser are the saturation pressures at the respective evaporation
and condensing temperatures. These temperatures are highly dependent
on the temperatures of the warm and cold water sources and their respective
mass flow rates. This relationship is discussed in more detail later
in this page. The mechanical power produced in the turbine is then transferred
to electrical energy in a generator. The output of this generator is
the Gross power produced by the cycle. Some of this power is then used
to drive the cold water pump and the ammonia pump, the remaining power
is known as the Net power produced by the cycle. The Net thermal efficiency
is defined as the ratio of the Net Power with the heat supplied to the
cycle from the warm water at the evaporator stage.Ā 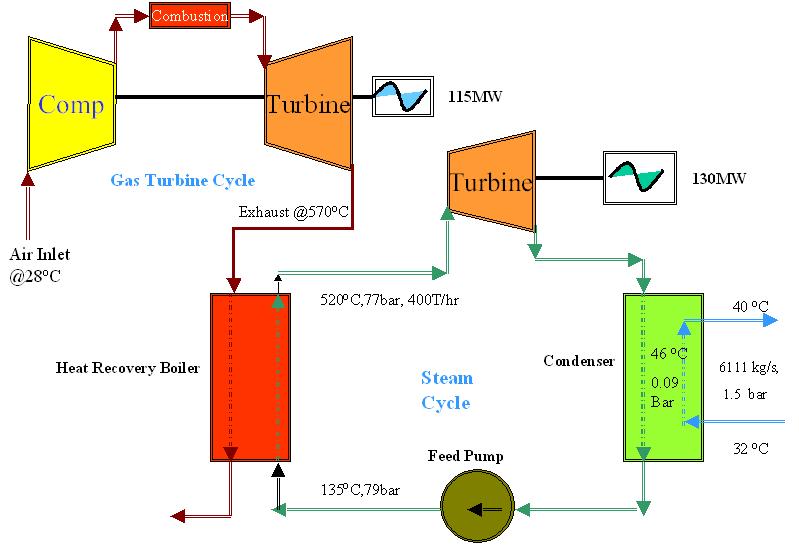


 The thermal efficiency also changes with a similar trend. To show how
this effects the yearly energy production from the OTEC plant the average
Net Power for each month of a typical year was plotted (chart 3).
The thermal efficiency also changes with a similar trend. To show how
this effects the yearly energy production from the OTEC plant the average
Net Power for each month of a typical year was plotted (chart 3). This was based on the average monthly ambient temperatures at the site
of the plant in India.Ā The average Net power over a typical year ranges
from a realistic value of 0.71 MW, to an optimistic value of 1.95 MW,
and a total yearly energy production of 6.23 GWhr (realistic) ranging
to 17 GWhr (optimistic). This shows a substantial reduction in the output
of approximately a third, when realistic heat exchanger assumptions
are introduced. However, 6.23 GWhr is still a huge amount of energy
that would otherwise have been wasted. In Britain, based on a market
value of 3 pence per unit of electricity, this energy could generate
Ż190,000 of revenue. The Net Power output in the winter season will
be reduced to zero, as the ambient temperature decreases. For the realistic
and optimistic cases during the winter months, the ambient temperature
is too low to provide sufficient warm water temperatures for OTEC Net
Power production. During these months the OTEC plant will now require
an input of external power from the main plant to remain operational
as the cooling mechanism for the steam cycle. This would not occur in
areas where a sufficiently high ambient temperature was maintained throughout
the year.Ā
This was based on the average monthly ambient temperatures at the site
of the plant in India.Ā The average Net power over a typical year ranges
from a realistic value of 0.71 MW, to an optimistic value of 1.95 MW,
and a total yearly energy production of 6.23 GWhr (realistic) ranging
to 17 GWhr (optimistic). This shows a substantial reduction in the output
of approximately a third, when realistic heat exchanger assumptions
are introduced. However, 6.23 GWhr is still a huge amount of energy
that would otherwise have been wasted. In Britain, based on a market
value of 3 pence per unit of electricity, this energy could generate
Ż190,000 of revenue. The Net Power output in the winter season will
be reduced to zero, as the ambient temperature decreases. For the realistic
and optimistic cases during the winter months, the ambient temperature
is too low to provide sufficient warm water temperatures for OTEC Net
Power production. During these months the OTEC plant will now require
an input of external power from the main plant to remain operational
as the cooling mechanism for the steam cycle. This would not occur in
areas where a sufficiently high ambient temperature was maintained throughout
the year.Ā for the same variations in ambient temperature, and chart 5
  shows
the yearly Net Power fluctuations. These are quite obviously akin to
charts 2 and 3 already discussed. Now we can see the overall effect
of the OTEC integration, when compared to the steam cycle operating
as a independent system. Clearly, the combined Net Power is simply the
sum of the two power supplies, this combination increases the Net Thermal
Efficiency inĀ a slightly different way as this must be calculated using
the ratio of the heat supplied at the heat recovery boiler of the Gas-Steam
cycle, to the combined Steam-OTEC Net Power output. As we would expect
the trend lines for this combined thermal efficiency follow an identical
pattern to that of the combined Net Power and are not shown here.
shows
the yearly Net Power fluctuations. These are quite obviously akin to
charts 2 and 3 already discussed. Now we can see the overall effect
of the OTEC integration, when compared to the steam cycle operating
as a independent system. Clearly, the combined Net Power is simply the
sum of the two power supplies, this combination increases the Net Thermal
Efficiency inĀ a slightly different way as this must be calculated using
the ratio of the heat supplied at the heat recovery boiler of the Gas-Steam
cycle, to the combined Steam-OTEC Net Power output. As we would expect
the trend lines for this combined thermal efficiency follow an identical
pattern to that of the combined Net Power and are not shown here. .
The optimistic case for the OTEC plant was chosen here. There is a significant
drop in the power output when the TTD is changed from 8oK
to 4oK. This shows that the Steam Cycle operating parameters
should not be changed beyond the optimum limits of the TTD in the condenser.
In the next set of experiments with Longannet Power Station, the TTD
has been set at the limit as a requirement to gain a sufficient exit
temperature from the Steam Cycle condenser for OTEC operation.
.
The optimistic case for the OTEC plant was chosen here. There is a significant
drop in the power output when the TTD is changed from 8oK
to 4oK. This shows that the Steam Cycle operating parameters
should not be changed beyond the optimum limits of the TTD in the condenser.
In the next set of experiments with Longannet Power Station, the TTD
has been set at the limit as a requirement to gain a sufficient exit
temperature from the Steam Cycle condenser for OTEC operation.