Energy and the Environment:
|
The sun supplies almost all the energy used on the earth. This energy drives the climate, the growth in plants (through photosynthesis) and provides heat and light. The sun is essential for life on earth.
The sun has a diameter of 1,390,000 km and (on average) is a distance of 1.5 ´ 10^8 km from earth. As summarised in Table 1, the sun is composed of several layers in an onion like structure. This structure affects the nature of the solar energy reaching the earth.
|
Layer |
Radius |
Characteristics |
|
Suns interior |
|
|
|
Inner core |
0-159,000 km |
Very dense 105kg/m3, very hot 40´ 106K, contains 40% of the mass of the sun and generates 90% of the suns energy, energy transferred away by X-ray and gamma-ray radiation. |
|
Outer core |
159,000-480,000 km |
Density and temperature reduces as distance from the centre increases. |
|
Convecting zone |
480,000-695,000 |
Density has fallen to 70kg/m3, and temperature to 130,000K, convective heat transfer (heat transfer by fluid/gas motion) occurs in this region. |
|
Photoshpere |
Surface of the convecting zone |
Upper layer of the convecting zone and the source of most solar radiation, this layer is opaque (absorbs and emits a continuous spectrum of radiation), temperatures are around 5,000K. Density is very low: 10-5 kg/m3 |
|
Suns atmosphere |
|
|
|
Reversing layer |
Depth: a few hundred km |
Transparent solar atmosphere composed of gases at a temperature of < 5,000K. |
|
Chromoshpere |
Depth: approx 10,000 km |
Transparent gases at a temperature of > 5,000K |
|
Corona |
|
A region of gas of almost negligible and high temperature of 106K |
Table 1: The structure of the sun.
Although the solar surface and atmosphere comprise regions of very different temperatures, the sun is often equated to a black body (i.e. a perfect radiator) at a temperature of 5,762K
The energy released from the sun comes about due to a fusion reaction in which hydrogen nuclei combine to from helium, releasing energy in the process. The evidence is strong that the overall reaction is:
4 1H + 2 e --> 4He + 2 neutrinos + 6 photons
In this reaction, the final nuclei (Helium) have less internal energy than the starting particles (Hydrogen). This difference is released as energy of motion of the nuclei and electrons in the solar gas, low energy photons and high energy neutrinos. The amount of energy involved is 26 MeV (or 26 x 10^6 eV) each time the abovereaction take place. 90% of the energy generated by the sun comes from this fusion reaction.
The suns energy reaches the earth as solar radiation, which is composed of discrete 'packets' of energy known as photons. The energy of a photon is dictated by its frequency:
E = hv
where E is the photon energy (J), h Plancks constant (6.62 x 10^-34 Js) and v the frequency of the photon (Hz). The sun radiates photons over a range of frequencies; these frequencies are related to the radiation wavelength (l ) by the equation
l = c/ v
where c is the speed of light in a vacuum (3 x 10^8 m/s).The range of wavelengths that the sun emits is known as the solar spectrum (figure 1). The majority of solar radiation lies within the wavelength range of 0.2 2.5 mm. The types of radiation emitted by the sun are classed by their wavelength. At shorter wavelengths there is X-rays, Gamma rays and ultraviolet radiation, while at the longer wavelengths there is infrared radiation and radio waves.

Figure 1: Standard spectral irradiance (lower spectrum corresponds to wavelength portion 400-800 mm).
Photons in the shorter wavelength portion of the spectrum have higher energy than those in the longer wavelength portion. The intensity of solar radiation (J/s or W/m^2) is known as the Radiant Flux Density (RFD), often referred to as irradiance or insolation. Outside the earths atmosphere insolation levels are approximately 1.35 kW/m^2. At the surface of the earth insolation levels are lower, e.g. at the equator at sea level insolation is approximately 1kW/m^2. The shape of the solar spectrum changes as it reaches the earths surface (the dotted line in figure 1). The missing portions of the spectrum are caused by the absorption of various wavelengths of solar radiation by the elements in the earths atmosphere. The power contained in the various portions of the solar spectrum are shown in table 2.
|
Wavelength range (nm) |
0-380 |
380-780 |
780+ |
|
Fraction of RFD in range |
0.07 |
0.4729 |
0.4571 |
|
Energy in range (W/m2) |
95 |
640 |
618 |
Table 2: breakdown of irradiance into wavelength ranges.
Solar radiation reaching the surface of the earth has two components direct or beam radiation and diffuse radiation. As the name suggests beam radiation arrives directly from the sun diffuse radiation is the portion of solar radiation, which is scattered in the Earths atmosphere. On a clear day beam radiation makes up about 90% of the total reaching the earths surface. The ratio of direct and diffuse radiation changes with the quantity of cloud and haze in the atmosphere (atmospheric turbidity): e.g. on heavily overcast days the beam component of solar radiation will be 0%. The total solar irradiance G (W/m^2) at a point on the earths surface is therefore the sum of the diffuse and beam radiation:
G = G beam + G diffuse
The direct component, G beam, of solar radiation falling on any surface can be calculated with knowledge of basic solar angles as follows.
|
Angle |
Symbol |
Description |
|
zenith |
y |
angle between beam radiation and the vertical |
|
altitude |
b |
angle between beam radiation and the horizontal |
|
solar azimuth angle |
g s |
angle between N-S and the solar beam |
|
incidence angle |
q |
angle between the beam radiation on a surface and the normal to that surface |
|
the surface-azimuth |
g |
angle between the surface normal and N-S |
|
the surface-solar azimuth angle |
a |
angle between the incident beam and the surface normal |
|
the tilt angle |
f |
angle of the surface above the horizontal |
Table 3: some basic solar angles.
Figure 3: basic solar angles.
The beam radiation falling on the surface can be split into its horizontal and vertical components:
Gv = Gn cosb cosa cosf
Gh = Gn sinb sinf
The total radiation intensity falling on the surface (W/m^2) is therefore
Gs = Gn (sinb sinf + cosb cosa cosf )
Diffuse radiation is assumed to be of equal intensity from all portions of the sky, so if the intensity of diffuse solar radiation falling on the ground is Gd, the radiation falling on a vertical surface will be 0.5Gd. Depending on the material from which the surface is constructed, the incident radiation will either be reflected (r), absorbed (a) or transmitted (t). So for an incident intensity of Gn, the reflected radiation intensity would be r Gn. The sum of the fractions for each process is unity:
r + a + t = 1.0
Opaque materials such as concrete will absorb and reflect solar radiation, transparent materials such as glass will reflect, absorb and transmit solar radiation. The preceding information can be used to estimate the solar radiation falling on a surfaces of different orientations and of different properties. This information can be used when designing a solar collector system. Such systems are of various types as illustrated by the following examples.
 |
 |
|
Figure 3:
A heliostat.
|
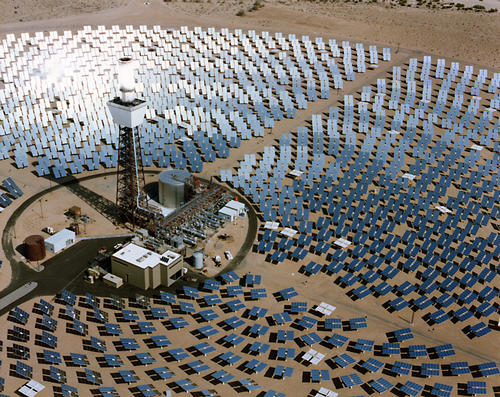
Figure 4:
A solar furnace (picture from NREL).
|
Solar furnaces: solar radiation is concentrated on a small point by hundreds of reflecting surfaces called heliostats. The resulting energy can be used to melt steel.
Solar power stations: parabolic solar collectors concentrate the suns rays at a point. Figure 5 shows concentrating collectors focusing solar radiation on a tube with water at high pressure. When passed through a heat exchanger this pressurised water can raise steam, which can then be passed to a turbine to generate electricity.
Figure 5: concentrating collectors.
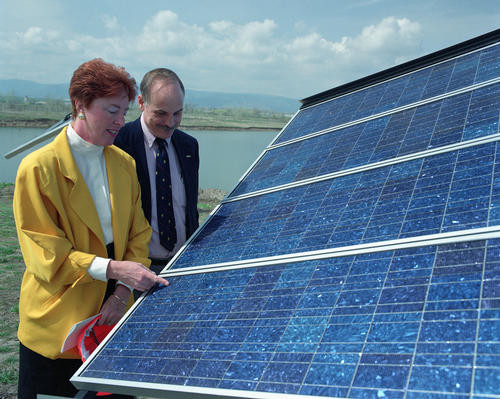
By far the most common type of solar collector is the flat plate solar collector, these are often found on the roofs of buildings throughout the US and in southern Europe. In these collectors solar energy is used to heat water, which can then be used inside the building. A typical collector has the following features.
 |
 |
|
Figure 6:
solar collectors on a building.
|
Figure 7:
a solar collector.
|
The rate at which heat is absorbed by the collector (W) is given by:
Qp = GsAt a
where Gs is the incident radiation (W), A the area of the collector (m^2), t the transmission factor of the cover and a the absorptance of the back plate. The losses from the collector are calculated fromQL = UA(Tc-Ta)
where U is the collector U-value (W/m^2 °C) , Tc is the average collector plate temperature and Tais the air temperature. The useful rate of energy recovery from the collector is therefore
QR = GsAt a - UA(Tc-Ta)
The temperature rise in the water flowing through the collector is given by:
D T = Qs/mC
where m is the water flow rate to the collector (kg) and C is the water specific heat (J/kg °C).
The simplest solar collector is a window, which admits heat and light into a building, reducing both fossil fuel consumption for heating and electrical energy consumption for lighting.
Back to Index
Photovoltaic materials produce electrical power from sunlight. The basic component of photovoltaic power conversion is the solar cell. The history of photovoltaic materials goes back to 1839 when Edmund Becquerel discovered the photo galvanic effect: where electric currents were produced from light induced chemical reactions. However it was not until 1954 that the first solar cell was developed with an efficiency of 6%: efficiency = power output/available solar power.
Solar cells found their first use in powering satellites, however their use for terrestrial power production has been growing rapidly. Figure 1 shows a diagram of a solar cell.
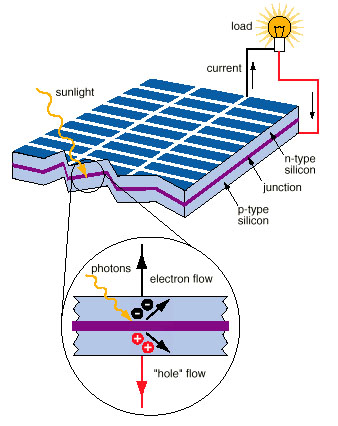
Figure 1: a solar cell.
The most common solar cell is a p-n junction, where the p-type (positive) and n-type (negative) materials are doped semiconductor(s). The p-n junction is a boundary in a semiconductor material where a region of electron depletion neighbours a region of electron surplus.
Figure 2: a p-n junction.
Solar cells are most commonly fabricated from silicon, however other materials such as cadmium and gallium may also be used. Silicon is a semiconductor material that is tetravalent, i.e. group IV of the periodic table. If silicon is doped with ions from a group III material it becomes an acceptor (p-type), when doped with a group V material it becomes a donator (n-type). The p-type material is said to have a surplus of holes (rather than a deficit of electrons).
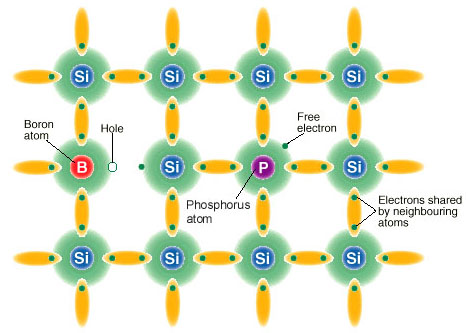
Figure 3: Doped silicon.
Four types of silicon semiconductor device are in use: monocrystalline, polycrystalline, thin film polycrystalline and amorphous. Monocrystalline silicon has a highly ordered atomic structure and cells made from it have the highest photovoltaic conversion efficiencies (18%). Polycrystalline silicon consists of many crystalline grains; the conversion efficiency of a solar cell manufactured from polycrystalline silicon is around 13%. A standard solar cell is typically cut from a large ingot of polycrystalline silicon and is typically between 200 and 400 microns thick.
In order for a current to flow in the semiconductor material, electrons in the valence orbitals (which form the bonds between the atoms) must be promoted to a higher energy level so that they are capable of conduction. The energy required for this is achieved by the absorption of photons of light. The amount of energy required for a valence electron to jump to this higher energy level is known as the band gap energy, Eg. This is an intrinsic property of the material (e.g. crystalline silicon has a band gap energy of 1.12 eV).
Figure 4: An electron excited into the conduction band.
The liberation of an electron from the valence band creates a corresponding vacancy in the valence band known as a hole. Electrons and holes are the charge carriers in the semiconductor material (i.e. the source of electrical current). In p-type materials the holes are the majority carriers, while in n-type materials electrons are the majority carriers.
The liberation of an electron from the valence band can be achieved by the interaction of a photon with the electron. The jump from the ground state to the excited state liberates one (and only one) electron-hole pair and requires the absorbed photon to have energy of
hv > Eg
where h is Plancks constant: 6.626 x10^-34 Js and v is the frequency (Hz). If a photon has an energy greater than Eg, it creates an electron-hole pair with an energy of greater than Eg, however the excess energy is soon dissipated as heat (figure 4).
Photons with a frequency less than Eg/h will not liberate an electron-hole pair. This creates a fundamental efficiency limitation in all photovoltaic conversion devices: only a fraction of the photons absorbed in the photovoltaic material will have a frequency greater than Eg/h (so-called above-band-gap photons) and much of the energy from the above-band-gap photons is wasted as heat. The silicon cell has metallic grids deposited on each side, which act as electrical contacts and allow electrons liberated by sunlight to flow: an electrical current will flow from the cell. Under standard test conditions of 1000W/m^2 irradiance and a cell temperature of 25°C a good solar cell will generate a potential difference of 0.5V and supply a current of up to 5A.
The output of a solar cell depends upon several factors: the properties of the semi-conductor material, the intensity of insolation, the cell temperature and the nature of the external loads the cell supplies. The combination of these factors gives rise to the characteristic operating curves, of generated current against the output voltage for the solar cell. A typical example is shown in figure 6.
Figure 6 Characteristic I-V curves for a solar cell.
In figure 6 Isc is the short circuited output of the cell, while Voc is the open circuit voltage. The maximum power of the cell occurs at the maximum power point (the knee of the curve in figure 6) where voltage is Vmpp and the current is Impp. The quality of a cell is indicated by its fill factor (FF):
FF = Vmpp Impp./ Isc Voc
The closer the fill factor to 1 the better the quality of the PV cell. The power output of the solar cell is related to the incident solar radiation and the cell temperature. The power output will vary linearly with incident solar radiation (when kept at the same temperature):
P max 25 = PSTC G/1000
where P max 25 is the power output at 25°C, PSTC the power output at standard test conditions (25°C and 1000W/m^2) and G the value of irradiance incidental on the module (W/m^2). Increasing temperature has a detrimental impact on the output of a solar cell: the hotter the cell operating temperature the poorer the efficiency of the cell. Typically efficiency will drop off by around 0.5% per °C increase in operating temperature. The following equation relates the cell temperature to its power output:
P max T = Pmax25 [1-b (T-25)]
where P max T is the power output at temperature T (°C), P max 25 the power output at 25°C and b the temperature coefficient of the cell (e.g. for a 0.5% drop of in efficiency this = 0.005). Substituting the previous expression gives the power output for the PV at any particular value of irradiance and temperature:
P max = PSTC G/1000 [1-b (T-25)]
PV arrays
The photovoltaic panel (or array) consists of a number of solar cells connected in a series and parallel configuration. The cells are encapsulated in a tough rigid structure containing the electrical contacts and circuitry required to remove the liberated electrons to an external circuit. The number of parallel-connected cell branches dictates the current output of the panel, while the number of cells connected in series determines the panel output voltage.
|
|
|
Figure 7 A PV panel.
The d.c. power output of the PV panel or array is suitable for such purposes as battery charging or supplying a resistive load. However, if a.c. electrical components are to be supplied with power and/or the PV system is connected to the grid, the power output of the PV source must be inverted. Inversion involves the conversion of the d.c. output to a.c. A device called an inverter is used to convert the d.c. output of the photovoltaic array to an alternating waveform.
Building-integrated PV
Various studies have identified the integration of PV materials into the building structure as one of the most cost effective means of utilising photovoltaic energy. The reasons for this are that capital costs are reduced, due to fact that the PV is an integral part of the structure and hence the cost of cladding and displaced materials is saved, while land and support structure cost are avoided and transmission losses are minimised. The most common and suitable type of mounting for new-build is the integral mounting. Here the PV panel forms part of the facade, with the PV panels having the same dimensions as the facade glazing elements. Modern building-facade compatible PV panels are constructed of a glass-resin-glass sandwich with the PV cells set between the outer glass layer and the resin. The glass used in the panel is usually low iron, to cut down on absorption of the incident solar radiation. The solar cells may also be treated with an anti-reflective coating, maximising the amount of solar radiation absorbed by them.
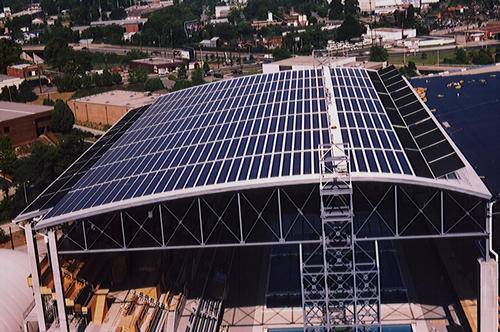
Figure 8 Photovoltaic panels integrated into the roof of a building.
A major barrier to the uptake of PV materials into the building structure is their low efficiency and high cost. Due to the impact of low radiation levels and high temperatures real of efficiencies of 12% have been calculated for crystalline silicon panels (compared to flash test efficiencies of over 18% in some cases). The result of the lower operational efficiencies of PV arrays is that their payback period becomes longer and they become less financially attractive. One method of boosting the operational efficiency of PV (when incorporated into a building façade) is to recover heated air from the rear of the panels. This boosts the efficiency in two ways.
|
|
|
Figure 9: the PV façade of the ELSA building in Italy and the corresponding schematic.
The effect of the recovery of heated air from the rear of the facade is to greatly increase the efficiency of the PV facade. Simulations have indicated combined efficiencies of up to 44% are possible during the heating season in some climates. The efficiency of the facade system will be greatest when all the heat can be of use in ventilation pre-heat, or direct heating. The temperature of the air recovered from the back of the panels can be as high as 60°C. A simple method to calculate the heat recovery from a PV façade is to treat it as a flat plate solar collector to that:
Qh = GA t a - GAe - UA(Tc Ta) = GA(t a -e ) - UA(Tc Ta)
where Qh is the heat recovery rate from the façade (W), G the incident solar radiation (W/m^2), A the façade area (m^2), Tc,Ta the façade and outside air temperatures, respectively (°C), U the façade U-value (W/m^2 °C), t the transmission through the PV modules, a the absorption of solar energy in the PV facade and e the efficiency of electrical conversion. Referring back to the previous expression for the electrical output from a PV cell, the total power output of the PV façade is given by
P max = n mPSTC G/1000 [1- Pp(T-25)]
where n is the number of cells in a PV module and m the number of modules in the facade.
Several buildings throughout Europe have been built with a PV façade including the BREs low energy office in Garston and the Doxford solar office in Northumbria.
Non-building use
PV materials are not only used on buildings. Common implementations include calculators and watches where the PV is used instead of batteries. PV has also been used to power cars and aircraft.
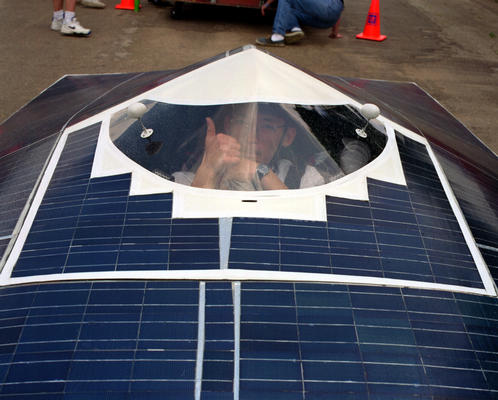
Figure 10: A photovoltaic-powered car.
PV is also used to power phone boxes and road lights in remote areas of Europe including Scotland. At the larger scale several photovoltaic power stations are operational in the US with outputs of over 5MW.
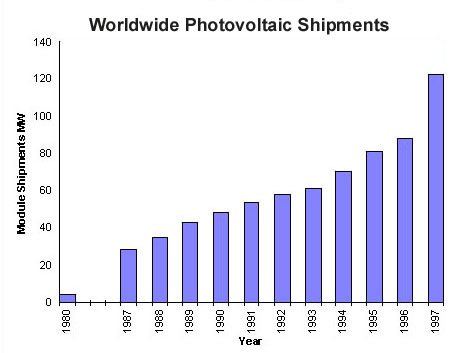
Figure 11: growth in the production of PV.
With their penetration into many areas of everyday life it is clear that photovoltaics will play an increasingly large part in renewable power production. In 1991 over 50MW of photovoltaic capacity was installed throughout the world and growth exceeding 20% per year.
Back to Index