J.
Gas Emissions
|
Exercise purpose: |
To become familiar with EnTrak's analysis of gaseous emissions. |
|
|
|
|
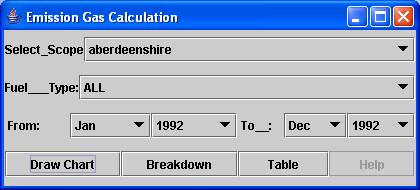
1. Open the Gas Emission manager. |
Choose 'Gaseous emission' from the 'Analysis' menu to evaluate environmental impact. This tool provides gas emission figures as a function of energy consumption and fuel type.
|
|
2. Set the condition parameters. |
Choose 'Aberdeenshire' in
the 'select_scope' menu. Choose 'ALL' in the 'Fuel_type ' menu and set the period as Jan 1992 - Dec 1992. |
|
|
|
|
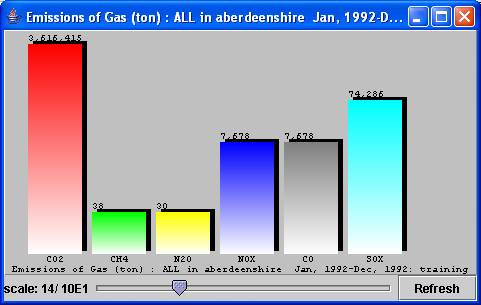
3. Draw charts of gas emission. |
Click the 'Draw Charts'
button.
|
|
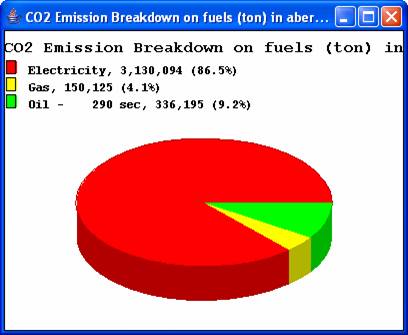
4. Make a CO2 emission breakdown chart on fuels. |
Click the 'Breakdown' button
to see the fuel breakdown as CO2 emissions.
|
|
|
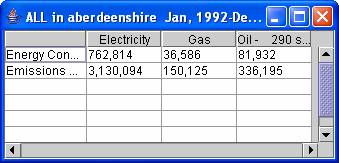
To see energy consumption
data and CO2 emissions, click the 'table' button.
|
|
5. Make another result chart. |
Create another chart and table changing the duration and scope. For instance, set the period to Jan 1993 - Dec 1993. Compare the result with the one of 1992. |
|
6. Close the opened windows. |
|
|
|
|
|
Exercise result: |
The ability to undertake a gaseous emissions analysis. |