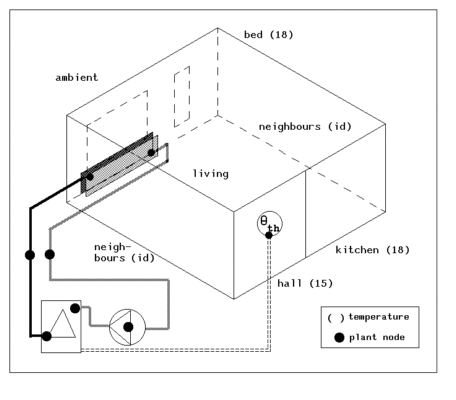
For the present study, the air temperatures of the spaces adjoining
the living room are kept at constant values. See Figure 7.12 (below) for
the building and plant model configuration and bounding spaces.
Ventilation
The model uses natural ventilation with infiltration only. The infiltration rate
(1.0 air changes per hour) was also kept constant.
Casual gains
A reference profile, as suggested by Van der Laan et al. (1988), is
used for casual gains.
The Plant
The heating system uses forced circulation. The heat source is a gas
boiler, with a radiator as the heat emitter. The radiator valve is manually
operated. The pump delivers a fixed water flow. The design temperatures of
the system are 90/70 C.
Heating system
For the model the heating system was divided into following elements.
- a (two node model) radiator (M = 25 kg; c = 600 J/kgK) with a nominal
heat emission of 2000 W (at nominal temperatures of 90/70/20), and heat emission
exponent of 1.3. The environmental temperature of the radiator is evaluated
from the living room air temperature and the inside surface temperatures of the
facade and the ground floor. The latter two are both assigned a weighting
factor of 0.5.
- the (two node model) boiler (M = 25 kg; c = 1000 J/kgK) , and with
respect to stand-by losses. The normalized start-stop losses are set at
1 s, and upper boiler temperature limit is set at 95 C. The gas consumption
in stand-by mode is set at 1% of the full load gas consumption. The latter
is scaled down to accommodate the current single radiator system: 8.3E-5
m3 /s gas with a caloric heating value of 35 MJ/m3 , which yields a heat
output of approximately 2500 W when the water-side efficiency is 0.86.
- a pump delivering a fixed water flow rate of 2.4E-5 m 3/s
- two connecting lengths (10 m each) of 15 mm wet central heating pipe
Control system
The heating system is controlled centrally by the on-off control of the
boiler, which is based on the mechanical room thermostat with acceleration
heating.
- a mechanical room thermostat (M = 0.05 kg; c = 1000 J/kgK) located
in the living room, and sensing a mix of air temperature and inside surface
temperature of the common dividing wall with the neighboring house and
the wall separating the living room from the hall. The equivalent thermal
conductances between these temperatures and the sensor were estimated at:
0.04, 0.01, and 0.01 W/K respectively. With respect to building/plant
interaction and control, the following was defined:
- a building side control function , defining that the heat output of
the radiator would be effectuated at the building zone air point. Note
that for all other plant components a constant containment temperature
of 18 C was assumed - a first plant control loop to actuate the boiler
on the basis of the temperature sensed by the room thermostat. Unless stated
otherwise, the set point temperature was 21.5 C, and a hysteresis of 0.5 K was
assumed.
- a second plant control loop sensing whether the boiler was actually
on or off during a certain simulation time step, and which - in the case
when it is on - inputs a heat flux into the sensing element. Thus, this control
loop simulates the acceleration heating of the room thermostat.

Fig. 7.12 Schematic representation of a building and plant configuration
comprising a living room serviced by (part of) a wet central heating system
Simulation and Results Analysis
Heat input for acceleration heating
The degree of heat input is the primary parameter to be considered in
the following results data. To illustrate the influence of the degree of acceleration
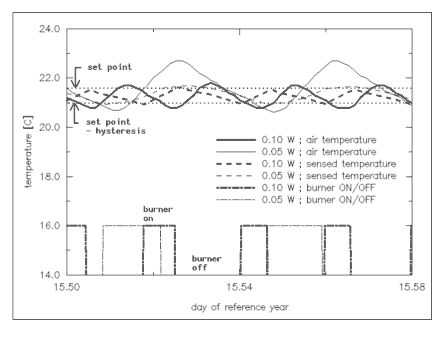
heating, Figure 7.13 shows simulation results from a two hour period, based
on a Dutch climatic reference year for energy research (Bruggen 1978).

Fig 7.13 Influence of acceleration heating on fluctuation of mean
living room air temperature and on temperature as sensed by the room thermostat
during a two hour simulation period
The simulations were performed for two values of thermostat heat input:
0.05 and 0.10 W. For the given conditions, this gives either approximately
1 or 2 cycles per hour, resulting in air temperature differentials of approximately
1 and 2 K respectively. Figure 7.13 also indicates the set point differential.
It may be seen that in the 0.05 W input case, the sensed temperature still
rises even after the burner is switched off. This is due to the fact that at
those points in time, the room air temperature is actually higher than the thermostat
set point. Note that there are two transient factors which play a role in the time
lag and damping of the sensed temperature when compared to the room air temperature:
- the sensed temperature depends on both air temperature and building
construction/materials temperatures (which lag behind because of the thermal
inertia of the building materials); and
- thermal inertia effects of the heating system itself.
As also demonstrated by Figure 7.13, the resulting average room air
temperature is further affected by the degree of acceleration heating; i.e.,
the average air temperature increases with decreasing acceleration heating.
The thermal load of the system
There is yet another factor which influences the resulting average room
air temperature: the thermal load of the system (which affects the length
of time the thermostat is switched on).

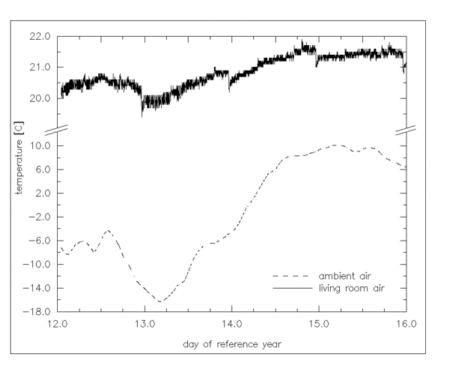
Figure 7.14 Influence of thermal load on sustained deviation between
room air temperature and set point (21.5 C) of the mechanical room thermostat.
Note the enlarged top y-axis scaling.
This is clearly demonstrated by Figure 7.14 which shows the room air
temperature (and its deviation from the thermostat set point) in relation
to the ambient temperature, which is obviously a measure of the thermal
load imposed on the heating system. When compared to average climatic
conditions for The Netherlands, the data for January 13 represents an extremely
cold day, while the data for January 15 represents a fairly average (ambient temperature)
winters day. For the simulations presented in Figure 7.14, a heat input to the
thermostat sensing element of 0.20 W was assumed, which resulted in burner cycle
frequencies of approximately 3, 4, and 5 per hour for the periods around 1:00 and 12:00
on January 13, and around 12:00 on January 15 respectively. This illustrates that
the cycle frequency decreases when the thermal load increases. The corresponding
relative burner-on periods were approximately 73%, 62%, and 32% respectively.
Gas consumption
| To investigate whether the overall gas consumption is also
affected, several simulations were performed for various degrees of accelerated
heating for the period between January 12 - 15. From the results presented
above, it may be clear that when the simulations start from a constant thermostat
set point, this would lead to different average room air temperatures.
obviously, the results would then be incomparable. Therefore, some of the
thermostat set points were chosen (by trial and error) such that the resulting
average room air temperature (for January 15) would be equal. The most
important simulation results - with respect to the investigated problem
- are collected in Table 7.6. When the cycle frequencies and the corresponding
air temperature differentials are compared with the thermal comfort criteria,
all cases presented in Table 7.6 fall within the comfort limits for transient
conditions. Only the cases with the smallest degree of heating acceleration
seem to be critical during the extremely cold day; i.e., air temperature differential
(= peak-to-peak amplitude) is approximately 3.3 K. |
|
Description
|
Unit
|
Parameter
Value
|
|
acceleration heating
|
W
|
0.20
|
0.10
|
0.05
|
0.01
|
0.01
|
|
set point
|
oC
|
22.4
|
21.5
|
21.5
|
21.5
|
20.8
|
|
overall average air temperature
|
oC
|
20.6
|
20.7
|
21.1
|
21.5
|
20.8
|
|
ditto but Jan 13 only
|
oC
|
20.4
|
20.7
|
21.1
|
21.3
|
20.4
|
|
ditto but Jan 15 only
|
oC
|
21.3
|
21.3
|
21.6
|
22.0
|
21.3
|
|
average cycle frequency Jan 13 only
|
h-1
|
4.0
|
1.8
|
1.0
|
0.8
|
0.8
|
|
average cycle frequency Jan 15 only
|
h-1
|
4.5
|
2.0
|
1.1
|
0.9
|
0.9
|
|
air temp.differential
Jan 13 only
|
K
|
0.3
|
1.3
|
2.3
|
3.3
|
3.3
|
|
air temp.differential Jan 15 only
|
K
|
0.3
|
1.0
|
2.1
|
3.0
|
3.0
|
|
total gas consumption
|
m3o
|
16.1
|
16.0
|
16.6
|
17.1
|
16.0
|
|
ditto but Jan 13 only
|
m3o
|
4.9
|
5.0
|
5.2
|
5.4
|
5.1
|
|
ditto but Jan 15 only
|
m3o
|
2.9
|
2.7
|
2.9
|
3.0
|
2.7
|
Table 7.6 Results of simulations - comprising the period
January 12 to January 15 inclusive - for various degrees of acceleration
heating applied to the mechanical room thermostat
|
It should be noted however, that the comfort criteria should be applied
to the operative temperature, the fluctuation of which is much smaller
than the air temperature fluctuation. This is evidenced by Figure 7.15
which shows simulation results for the "0.01 W and O = 21.5 C"
case during January 15. From this figure it may also be concluded that
in order to create thermally comfortable conditions, the thermostat set
point would have to be higher than 21.5 C, because the operative temperature
falls below the thermal comfort zone (if we assume normal indoor clothing
and nearly sedentary activity).

|
Figure 7.15 Air, mean radiant, and operative temperature during January
15 of the reference year, for U = 0.01 W and O = 21.5 C th set
When comparing the gas consumption results for the cases with equal
average air temperature, Table 7.6 indeed evidences that it is possible
to conserve energy - while maintaining thermally comfortable conditions
- by decreasing the burner cycle frequency. Lowering the cycle frequency
from 4.5 to 2.0 h-1, results in a gas consumption reduction
of only 1% when the whole period is taken into account, but in a 7% reduction
when just the "average heating season day" (i.e., January 15) is
taken into account. This suggests that the optimal strategy is to apply
the "cycle frequency control" strategy selectively; i.e., weather
dependent. Obviously, these results require further investigation with respect
to what is the optimal strategy (i.e., development of a rules-based system
for intelligent controllers), and for which type of systems is it applicable.
In the present context, this case study should be regarded only as a demonstration
of an application of computer simulation modelling.
References
- Bruggen, R.J.A. van der 1978. " Energy consumption for
heating and cooling in relation to building design," Doctoral dissertation
Eindhoven University of Technology (FAGO).
- Hensen, J.L.M., L.C.H. Dings, and W.J.A. van de Ven 1987. "Meet-
project Someren," rapport FAGO 87.08.K., Technische Universiteit Eindhoven,
Eindhoven.
- Laan, M.J. van der, M. Dubbeld, and J.E.F. van Dongen 1988.
"Ontwerp van een standaard referentiegedrag voor energiever- bruiksberekeningen,"
TNO-MT rapport R 88/080, Delft.
- NOVEM 1990. Referentie Tuinkamerwoning, Nederlandse Maatschappij
voor Energie en Milieu, Sittard.


